Observability
Observability is built into services created via @RegisterAiService and is provided in the following form:
-
Metrics are enabled when
quarkus-micrometeris part of the application -
Traces are enabled when
quarkus-opentelemetryis part of the application
Metrics
Each AI method is automatically timed and the timer data is available using the langchain4j.aiservices.timed metric with the appropriate tags.
A counter is also available using the langchain4j.aiservices.counted metric.
For example, if the AI service looks like:
@RegisterAiService
public interface PoemAiService {

    @SystemMessage("You are a professional poet")
    @UserMessage("Write a poem about {topic}. The poem should be {lines} lines long")
    String writeAPoem(String topic, int lines);
}
and one chooses to use quarkus-micrometer-registry-prometheus, then the metrics could be:
# HELP langchain4j_aiservices_timed_seconds
# TYPE langchain4j_aiservices_timed_seconds summary
langchain4j_aiservices_timed_seconds_count{aiservice="PoemAiService",method="writeAPoem",} 1.0
langchain4j_aiservices_timed_seconds_sum{aiservice="PoemAiService",method="writeAPoem",} 4.241446681
# HELP langchain4j_aiservices_timed_seconds_max
# TYPE langchain4j_aiservices_timed_seconds_max gauge
langchain4j_aiservices_timed_seconds_max{aiservice="PoemAiService",method="writeAPoem",} 4.241446681

# HELP langchain4j_aiservices_counted_total
# TYPE langchain4j_aiservices_counted_total counter
langchain4j_aiservices_counted_total{aiservice="PoemAiService",exception="none",method="writeAPoem",result="success",} 1.0
Token usage and estimated cost
Each chat model call also reports token usage through the gen_ai.client.token.usage metric, following the
GenAI semantic conventions. The gen_ai.token.type tag
distinguishes the token categories:
-
input: prompt tokens sent to the model -
output: tokens generated by the model -
cache_read: input tokens served from the provider prompt cache (a cache hit) -
cache_creation: input tokens written to the provider prompt cache
The cache_read and cache_creation types are only emitted by providers that report prompt cache token counts.
Among the built-in providers, Bedrock and Anthropic report both cache read and cache creation tokens, while OpenAI
and Gemini report only cache read tokens. An estimated cost is additionally reported through
gen_ai.client.estimated_cost when a CostEstimator bean is available.
For example, the metrics could be:
# HELP gen_ai_client_token_usage_total
# TYPE gen_ai_client_token_usage_total counter
gen_ai_client_token_usage_total{gen_ai_operation_name="chat",gen_ai_token_type="input",} 42.0
gen_ai_client_token_usage_total{gen_ai_operation_name="chat",gen_ai_token_type="output",} 18.0
gen_ai_client_token_usage_total{gen_ai_operation_name="chat",gen_ai_token_type="cache_read",} 30.0
gen_ai_client_token_usage_total{gen_ai_operation_name="chat",gen_ai_token_type="cache_creation",} 12.0
Other extensions can report their own cache token counts by exposing a CacheTokenUsageExtractor CDI bean.
Tracing
Each AI method creates its own span using the langchain4j.aiservices.$interface_name.$method_name template for the name.
Furthermore, tool invocations also create a span using langchain4j.tools.$tool_name template for the name.
For example, if the AI service looks like:
@RegisterAiService(tools = EmailService.class)
public interface PoemAiService {

    @SystemMessage("You are a professional poet")
    @UserMessage("Write a poem about {topic}. The poem should be {lines} lines long. Then send this poem by email.")
    String writeAPoem(String topic, int lines);

}
a tool that looks like:
@ApplicationScoped
public class EmailService {

    @Inject
    Mailer mailer;

    @Tool("send the given content by email")
    public void sendAnEmail(String content) {
        Log.info("Sending an email: " + content);
        mailer.send(Mail.withText("sendMeALetter@quarkus.io", "A poem for you", content));
    }

}
and invocation of the AI service that looks like:
@Path("/email-me-a-poem")
public class EmailMeAPoemResource {

    private final MyAiService service;

    public EmailMeAPoemResource(MyAiService service) {
        this.service = service;
    }

    @GET
    public String emailMeAPoem() {
        return service.writeAPoem("Quarkus", 4);
    }

}
then an example trace is:
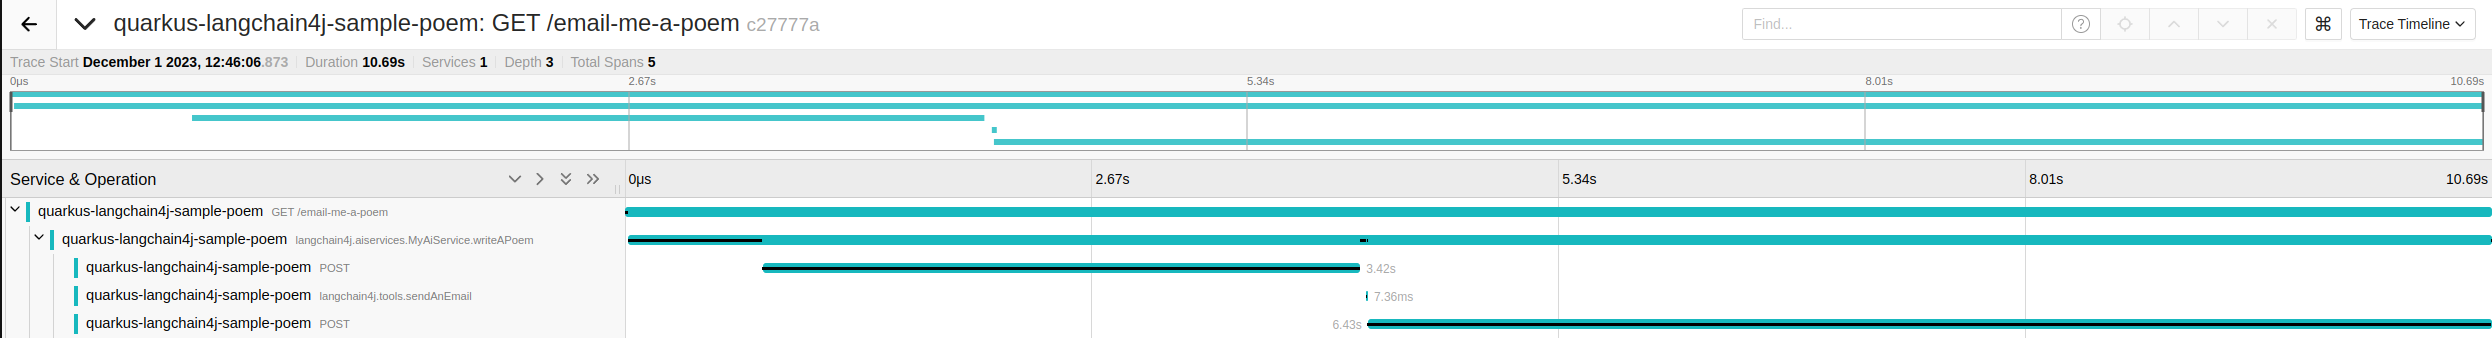
In the trace above we can see the parent span which corresponds to the handling the GET HTTP request, but the real
interesting thing is the langchain4j.aiservices.MyAiService.writeAPoem span which corresponds to the invocation of the AI service.
The child spans of this span correspond (from to right) to calling the OpenAI API, invoking the sendEmail tool and finally invoking calling the OpenAI API again.
Custom span data
if you have the need for custom span data, you can simply add a bean implemtenting ChatModelSpanContributor.
import io.quarkiverse.langchain4j.runtime.listeners.ChatModelSpanContributor;
import dev.langchain4j.model.chat.listener.ChatModelErrorContext;
import dev.langchain4j.model.chat.listener.ChatModelRequestContext;
import dev.langchain4j.model.chat.listener.ChatModelResponseContext;
import io.opentelemetry.api.trace.Span;

@ApplicationScoped
public class CustomSpanDataContributor implements ChatModelSpanContributor {
    public void onRequest(ChatModelRequestContext requestContext, Span currentSpan) {
        span.addAttribute("example", "request");
    }

    public void onResponse(ChatModelResponseContext responseContext, Span currentSpan) {
        span.addAttribute("example", "response");
    }

    default void onError(ChatModelErrorContext errorContext, Span currentSpan) {
        span.addAttribute("example", "failure");
    }
}
Langfuse
The Quarkus Langfuse extension provides seamless integration with Langfuse for tracing AI operations. When both quarkus-opentelemetry and quarkus-langfuse are present, all of the necessary OpenTelemetry configuration is handled automatically.
Step 1: Add Dependencies
Add the quarkus-opentelemetry and quarkus-langfuse dependencies to your pom.xml (Gradle users can include equivalent coordinates in Gradle):
<dependency>
    <groupId>io.quarkus</groupId>
    <artifactId>quarkus-opentelemetry</artifactId>
</dependency>
<dependency>
    <groupId>io.quarkiverse.langfuse</groupId>
    <artifactId>quarkus-langfuse</artifactId>
</dependency>
Step 2: Configure Langfuse Connection
Sign up for Langfuse Cloud or self-host Langfuse, then configure the connection in application.properties:
quarkus.langfuse.base-url=https://cloud.langfuse.com
quarkus.langfuse.username=<your public key>
quarkus.langfuse.password=<your secret key>
That’s it. The quarkus-langfuse extension automatically configures:
-
The OTLP trace exporter endpoint (derived from
base-url) -
Authorization headers (Basic auth from
username/password) -
Span filtering — by default only
gen_aispans and their ancestors are exported (AI_ONLYmode) -
Prompt and completion tracing (
include-prompt,include-completion,include-tool-arguments,include-tool-resultall set totrue) -
Automatically set Langfuse’s specific
inputandoutputspan attributes for better trace visualization in Langfuse -
Dual exporting to both a standard LGTM stack AND langfuse
|
In dev and test mode, Langfuse DevServices automatically starts a local Langfuse instance and configures the connection properties for you — no manual configuration needed. |
|
See the Quarkus Langfuse documentation for additional configuration options, such as changing the span filter mode or customizing timeouts. |
Step 3: Run a Test AI Operation
Start your Quarkus application. Trigger an AI operation that Quarkus LangChain4j handles — for example, call a service or controller that uses a ChatModel to generate a completion.
A complete example can be found here.
@RegisterAiService(tools = EmailService.class)
public interface MyAiService {

    /**
     * Ask the LLM to create a poem about the given topic.
     *
     * @param topic the topic of the poem
     * @param lines the number of line of the poem
     * @return the poem
     */
    @SystemMessage("You are a professional poet")
    @UserMessage("""
            Write a single poem about {topic}. The poem should be {lines} lines long and your response should only include the poem itself, nothing else.
            Then send this poem by email. Your response should include the poem.
            """)
    String writeAPoem(String topic, int lines);

}

@Singleton
public class Startup {

    public void writeAPoem(@Observes StartupEvent event, MyAiService service) {
        System.out.println(service.writeAPoem("LangFuse", 4));
    }
}
Troubleshooting
No Traces:
-
Check the logs of the application for potential clues
-
Check Troubleshooting page
Manual Configuration (without quarkus-langfuse)
If you prefer not to use the quarkus-langfuse extension, you can configure the OpenTelemetry exporter manually to point to Langfuse’s OTLP endpoint:
quarkus.otel.exporter.otlp.traces.protocol=http/protobuf
quarkus.otel.exporter.otlp.endpoint=https://cloud.langfuse.com/api/public/otel
quarkus.otel.exporter.otlp.headers=Authorization=Basic <base64 of public_key:secret_key>
You will also need to manually enable prompt tracing:
quarkus.langchain4j.tracing.include-prompt=true
quarkus.langchain4j.tracing.include-completion=true
quarkus.langchain4j.tracing.include-tool-arguments=true
quarkus.langchain4j.tracing.include-tool-result=true
See the Langfuse OpenTelemetry documentation for more details on authentication and manual setup.
Comet Opik
You can also send Quarkus LangChain4j traces to Comet Opik via OpenTelemetry.
Step 1: Enable OpenTelemetry in Quarkus LangChain4j
Use the same setup as in the Langfuse section:
-
Add the
quarkus-opentelemetrydependency -
Set
quarkus.otel.exporter.otlp.traces.protocol=http/protobuf -
Optionally enable prompt and completion tracing via
quarkus.langchain4j.tracing.*
Step 2: Configure Opik OTLP endpoint and headers
Set your OpenTelemetry exporter endpoint and headers to the Opik values from your project settings.
QUARKUS_OTEL_EXPORTER_OTLP_ENDPOINT=<opik_otlp_endpoint>
QUARKUS_OTEL_EXPORTER_OTLP_HEADERS=<opik_otlp_headers>
Or configure in application.properties:
quarkus.otel.exporter.otlp.endpoint=<opik_otlp_endpoint>
quarkus.otel.exporter.otlp.headers=<opik_otlp_headers>Auditing
| The Quarkus-specific auditing features have been deprecated and removed. They have been replaced by LangChain4j AI Service Observability. You can observe the LangChain4j observability events as CDI events. |
The extension allows users to audit the process of implementing an AiService by observing normal CDI events. See the LangChain4j AI Service Observability tutorial for more information about the types of events that can be observed.
The main difference is that in Quarkus, you do not need to create an implementation of an AiServiceListener. Instead, just create a bean class (or multiple bean classes) and observe them using the CDI observer pattern.
All the events for a single invocation can be correlated by event.invocationContext().invocationId().
The following example shows a class that audits all events fired by select AI Services.
| These methods do not all need to live in the same class and the name of the class and the methods do not matter. It is only shown this way for demonstration purposes. |
By default, an observer method will be fired from ANY AI Service. If you’d like to scope the observer to a particular AI Service, you can do so using the io.quarkiverse.langchain4j.observability.AiServiceSelector annotation.
See an example below:
import dev.langchain4j.observability.api.event.AiServiceCompletedEvent;
import dev.langchain4j.observability.api.event.AiServiceErrorEvent;
import dev.langchain4j.observability.api.event.AiServiceResponseReceivedEvent;
import dev.langchain4j.observability.api.event.AiServiceStartedEvent;
import dev.langchain4j.observability.api.event.InputGuardrailExecutedEvent;
import dev.langchain4j.observability.api.event.OutputGuardrailExecutedEvent;
import dev.langchain4j.observability.api.event.ToolExecutedEvent;

import io.quarkiverse.langchain4j.observability.AiServiceSelector;

@ApplicationScoped
public class AuditingListener {
	public void aiServiceStarted(@Observes AiServiceStartedEvent serviceStartedEvent) {
        // Invoked when the invocation begins on any AI service
	}

    public void assistant1ServiceStarted(@Observes @AiServiceSelector(Assistant1.class) AiServiceStartedEvent serviceStartedEvent) {
        // Invoked when an invocation begins on the Assistant1 AI service
	}

	public void aiServiceCompleted(@Observes AiServiceCompletedEvent serviceCompletedEvent) {
		// Invoked when the final result of any AiService method has been computed
	}

    public void assistant1ServiceCompleted(@Observes @AiServiceSelector(Assistant1.class) AiServiceCompletedEvent serviceCompletedEvent) {
		// Invoked when the final result of the Assistant1 AiService method has been computed
	}

	public void aiServiceError(@Observes AiServiceErrorEvent serviceErrorEvent) {
		// Invoked when there was an exception computing the result of the AiService method
	}

    public void assistant2ServiceError(@Observes @AiServiceSelector(Assistant2.class) AiServiceErrorEvent serviceErrorEvent) {
		// Invoked when there was an exception computing the result of the Assistant2 AiService method
	}

	public void serviceResponseReceived(@Observes AiServiceResponseReceivedEvent serviceResponseReceivedEvent) {
		// Invoked with a response from an LLM on any AI Service.
        // It is important to note that this can be invoked multiple times when tools exist.
	}

	public void toolExecuted(@Observes ToolExecutedEvent toolExecutedEvent) {
		// Invoked with a tool response from an LLM.
        // It is important to note that this can be invoked multiple times when tools exist.
	}

    public void assistant3ToolExecuted(@Observes @AiServiceSelector(Assistant3.class) ToolExecutedEvent toolExecutedEvent) {
		// Invoked with a tool response from the Assistant3 AI service.
        // It is important to note that this can be invoked multiple times when tools exist.
	}

    public void inputGuardrailExecuted(@Observes InputGuardrailExecutedEvent inputGuardrailExecutedEvent) {
        // Invoked after an InputGuardrail is invoked on any AI service
        // Could be invoked multiple times in a single LLM invocation
    }

    public void assistant4InputGuardrailExecuted(@Observes @AiServiceSelector(Assistant4.class) InputGuardrailExecutedEvent inputGuardrailExecutedEvent) {
        // Invoked after an InputGuardrail is invoked on the Assistant4 AI service
        // Could be invoked multiple times in a single LLM invocation
    }

    public void outputGuardrailExecuted(@Observes OutputGuardrailExecutedEvent outputGuardrailExecutedEvent) {
        // Invoked after an OutputGuardrail is invoked on any AI service
        // Could be invoked multiple times in a single LLM invocation
    }
}