Dev UI panel
When running in dev mode, Goblin provides a control panel in the Quarkus Dev UI (accessible at /q/dev). You reach it by clicking the Goblin card in the extension grid:
The Goblin card in the Dev UI extension grid.
Chaos Dashboard
The dashboard is the main control surface. It exposes the master toggle, the target level, the chaos layers, the profile, per-type toggles and configuration forms, quick picks, and live assault counters.
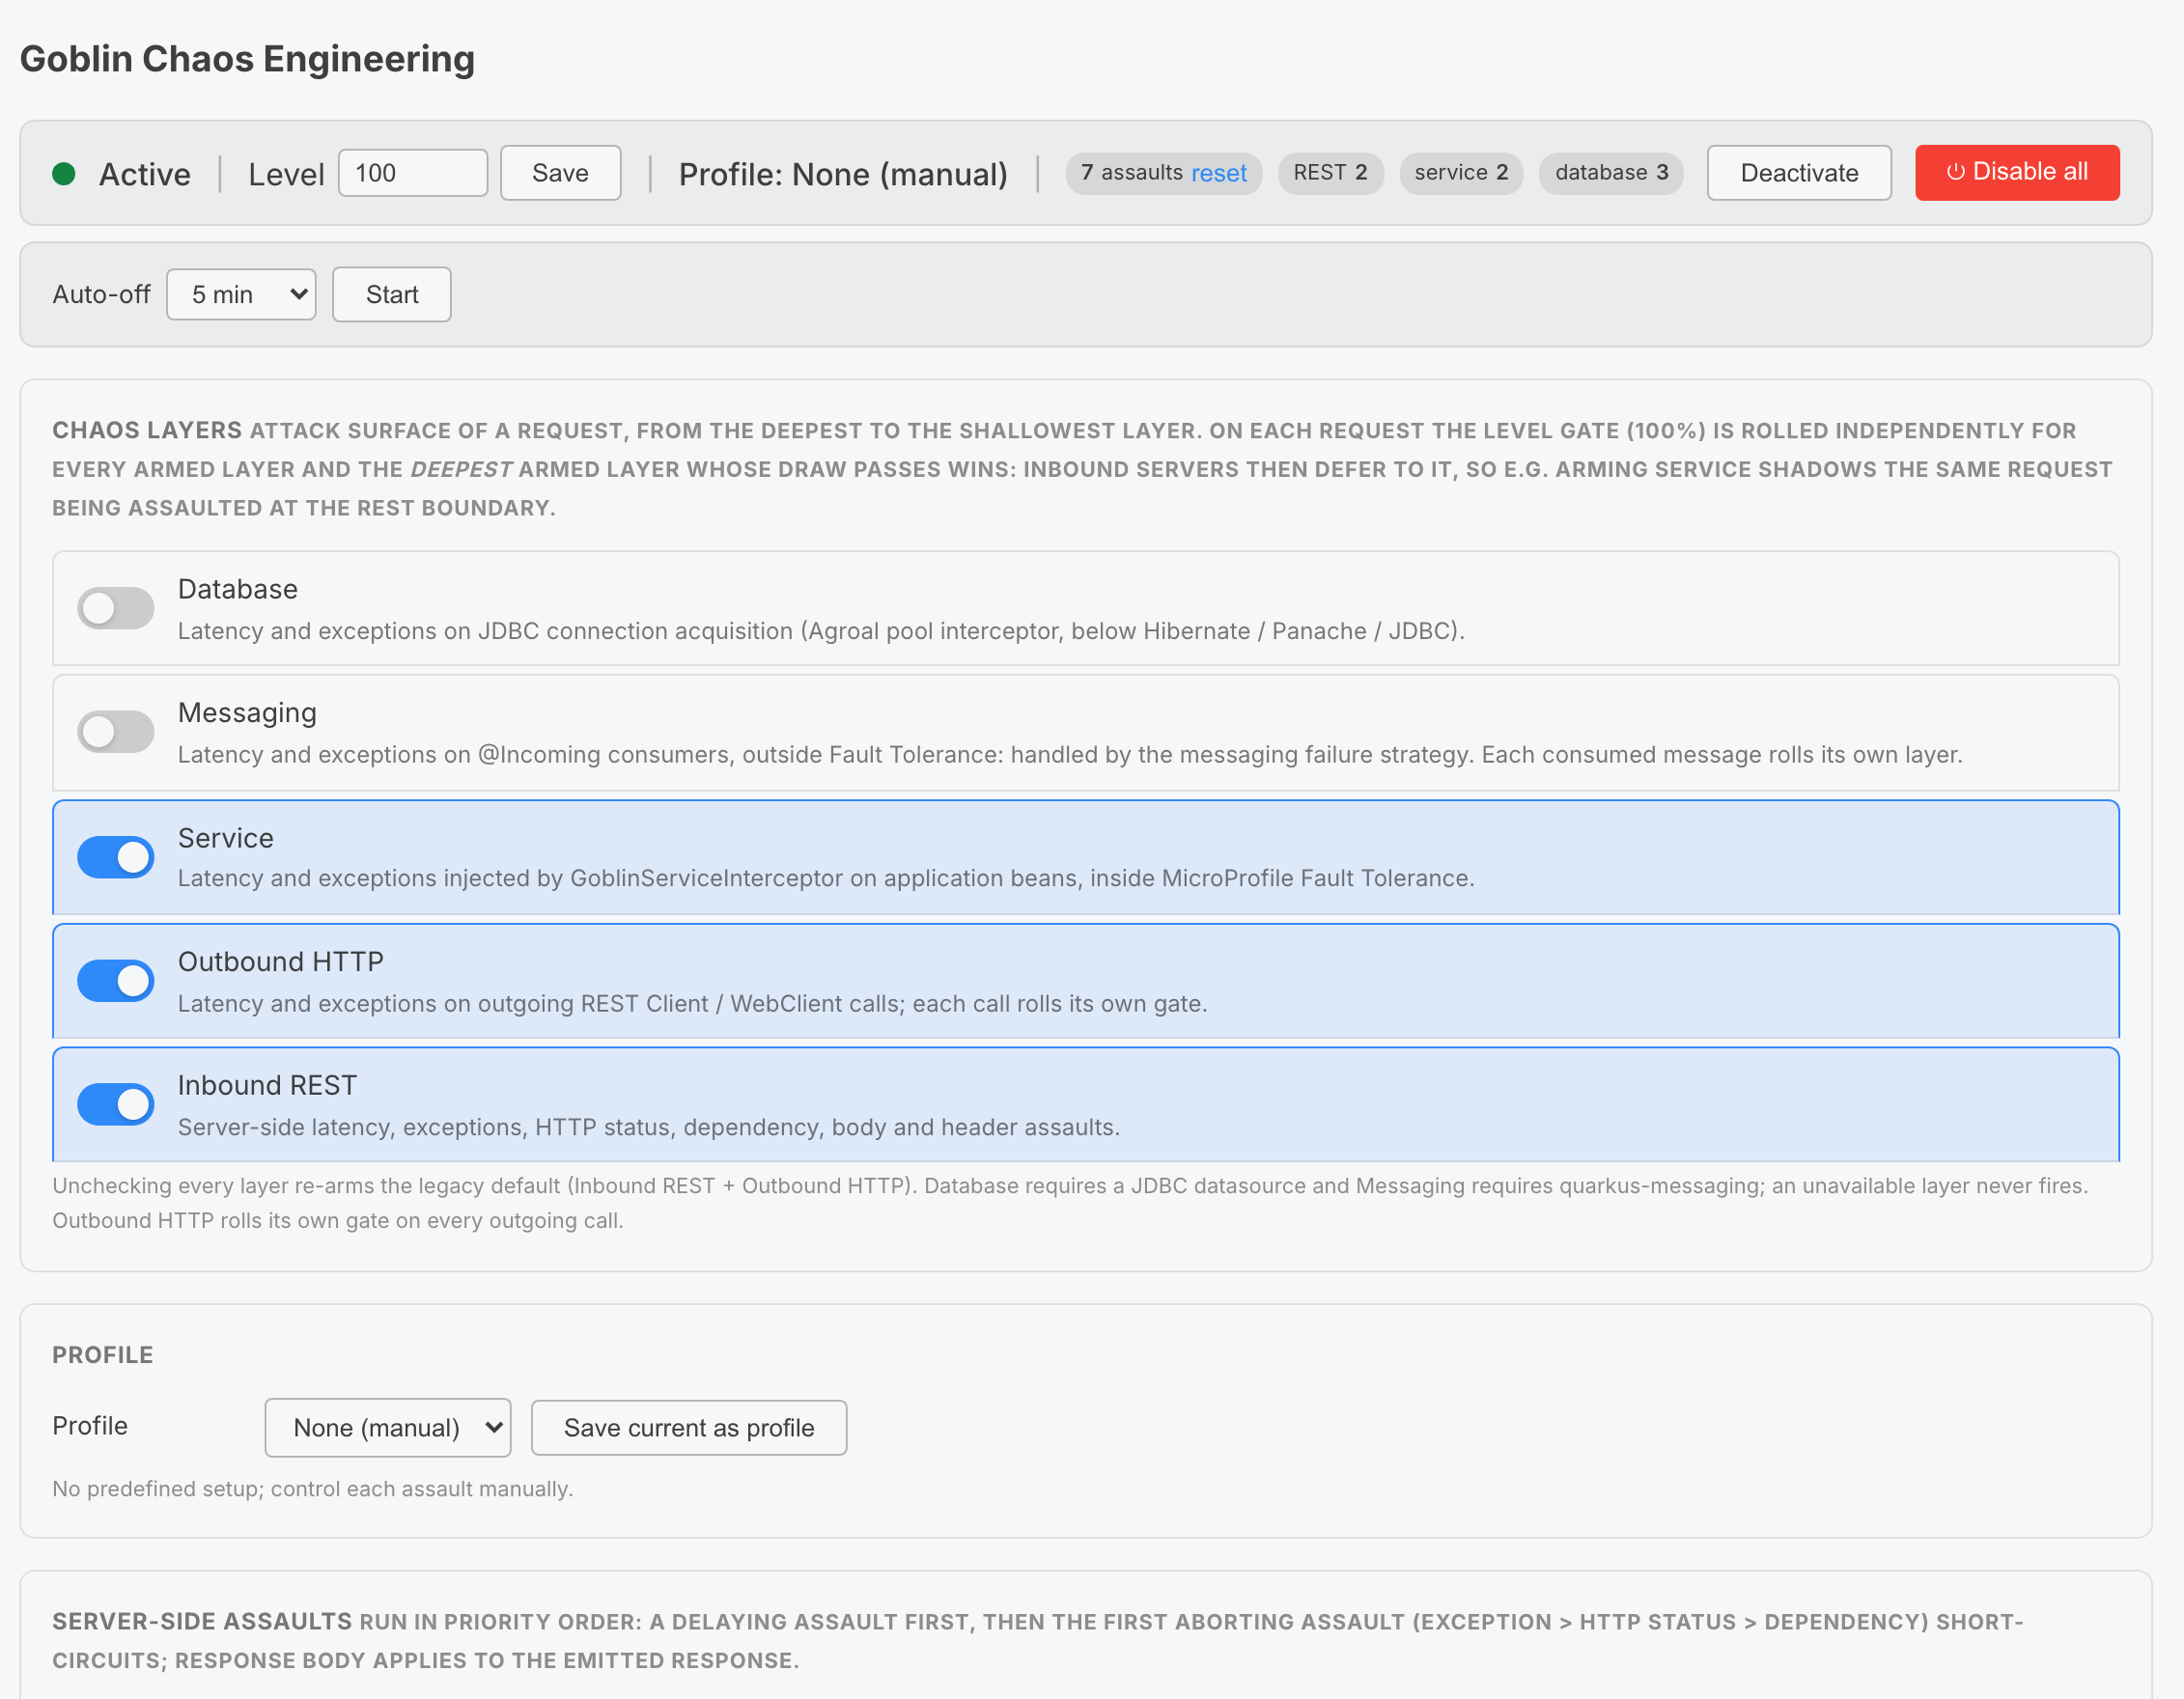
The Chaos Dashboard with latency enabled at 100% target level.
-
Master toggle — Activate/deactivate all chaos with a single click. When inactive, the status dot turns red and the
Deactivatebutton becomesActivate, and the status bar says why chaos is off (a deactivation from this dev session, a fired auto-off,quarkus.goblin.enabled=false, or a test run withoutquarkus.goblin.test.enabled). A deactivation belongs to the dev session: it survives the live reloads of the running dev process, so saving a file does not re-arm chaos, and it is kept for the same reason as the auto-off, outside.goblin-state.json. A new process takes the active flag back fromquarkus.goblin.enabled. -
Active goblin — While chaos is active, an animated goblin casting a spell sits in the bottom-right corner of the Chaos Dashboard and History pages, so a glance tells you the application is under attack; it disappears as soon as chaos is off. With the operating system’s reduced-motion setting, a still image replaces the animation.
-
Kill switch —
Disable all(orCtrl/Cmd+Shift+Xwhile the Chaos Dashboard is open) asks for confirmation, then deactivates chaos, turns every assault type and client-side assault off, resets the profile toNONEand cancels any pending auto-off. -
Auto-off — Optionally deactivate chaos automatically after 5, 10, 30 or 60 minutes. The deadline is held by the engine, not by the browser: chaos switches off at the deadline even when the Dev UI is closed, and a pending auto-off survives a live reload. Once it has switched chaos off, chaos stays off across live reloads until you switch it on again. A countdown shows the remaining time and can be cancelled; deactivating chaos (master toggle or kill switch) cancels it too. The master toggle sends the state you asked for, so clicking
Deactivatejust as the auto-off fires never switches chaos back on. -
Blast radius warning — A banner warns when chaos is active with two or more server-side assaults at a 100% level: every eligible request is then assaulted.
-
Live counters — The status bar shows the total number of assaults since the last reset (with a
resetaction) and one chip per source that fired (REST,service,database,messaging,REST client,WebClient), refreshed every 2 seconds together with the config. -
Profile selector — Pick a predefined composite assault mode (
NONE,SLOW_FAILURE,INTERMITTENT,TIMEOUT); a predefined profile other thanNONEasks for confirmation before it is applied. It turns every server-side assault off, then enables its own assaults with their defaults (see Profiles). The active profile is shown in the status bar, with anoverridemarker when a server-side toggle no longer matches the profile. Individual toggles stay overridable on top of the profile. -
Custom profiles —
Save current as profileasks for a name and stores the current configuration in the browser (not on the server). A custom profile is re-applied from the profile selector (Custom: <name>) and removed withDelete active. The status bar keeps showing the predefined profile held by the engine (oftenNone (manual)); the custom name only appears in the selector. -
Scenarios —
Save current as scenariostores the whole assault configuration under a name, on disk;Loadreplaces the configuration by the selected scenario andDeleteremoves it. See Scenarios. -
Assault type toggles — Independent on/off switches for each assault type (Latency, Exception, HTTP Status, Dependency Degradation, Response Body, Response Header). Multiple types can be active simultaneously. Enabled types are highlighted with the Quarkus primary color, and each row shows its priority.
-
Priority badges — Each assault row shows when it runs:
10latency,20exception,30HTTP status and40dependency degradation run in that order before the endpoint (the first aborting one short-circuits the request);Rmarks the response-phase transformations (response body, then response headers);Cmarks the client-side assaults on outgoing calls. -
Client-side assault toggles — A dedicated section controls
client latencyandclient exception, applied to outgoing MicroProfile REST Client and Vert.x WebClient calls. They default to off and reuse the latency range and exception class/message configured above. -
Quick picks — One-click presets in the Exception section (verified exception classes, served by the engine and guaranteed to be throwable — no fallback) and in the HTTP Status section (
500,503,429,404). A pick fills the form; clickSaveto apply it. -
Config sections — Each assault type has its own configuration section (latency range, exception class/message, HTTP status code/message, response body mode/percentage, response header rules as editable rows with a single
Save headersaction). While a type is off, its section only shows a summary of the current values (e.g.Current: 503. Enable HTTP status assault to configure.); enable the type to display and edit its parameters. Every section has its ownSavebutton, enabled once the form is modified. -
Validation — The latency, exception, HTTP status, response body and level forms are checked as you type: an invalid value (for example a latency
mingreater thanmax) shows a message and keepsSavedisabled. The response header rules are checked when you clickSave headers: an empty name or a name that is not an HTTP token is reported in an error toast and nothing is saved. Values the forms accept are still checked by the engine, which may correct them (see Configuration validation); the correction is shown in a toast. -
Target level — A numeric field (0-100%) in the status bar sets the percentage of affected requests, saved with its own button.
-
Chaos layers — A dedicated section lists one switch per chaos layer, from the deepest to the shallowest:
Database,Messaging,Service,Outbound HTTPandInbound REST(DATABASE,MESSAGING,SERVICE,HTTP_OUT,HTTP_IN). Only the armed layers are candidates each request; the deepest armed layer whose probability roll passes wins for that request (see Chaos layers).Database(requires a JDBC datasource) andMessaging(requiresquarkus-messaging) are marked unavailable and cannot be switched on when the application lacks the matching extension. By defaultHTTP_INandHTTP_OUTare armed, which keeps the pre-layers behaviour; switching every layer off re-arms that default. -
Danger zone — Export the current configuration as a JSON file, import a previously exported one (or any partial config), or reset the whole configuration. The reset asks for confirmation, then restores the built-in defaults — not the values of
application.properties: latency assault on with100-5000ms, every other assault off, HTTP503, level100, no header rules, layersHTTP_IN+HTTP_OUT. It leaves the active flag and any pending auto-off unchanged. An import is applied at once: a rejected file changes nothing. -
All changes apply instantly — no restart needed. A WARN log is emitted in the console for every change, and a toast confirms each action in the UI. If the engine corrects a value (see Configuration validation), the toast shows the applied correction.
-
Persistence — In dev mode every configuration change is written to
.goblin-state.jsonin the project directory, and that file is loaded at the next start instead of thequarkus.goblin.assault.*andquarkus.goblin.target.levelproperties (the active flag excepted). The deactivation and the auto-off are deliberately kept out of that file, so it can never arm an extension you disabled withquarkus.goblin.enabled=false. Delete the file to start again fromapplication.properties(see Configuration reference).
| When chaos is deactivated, every toggle and form stays editable: you can prepare your assault configuration before turning chaos on. |
Scenarios
A scenario is a named snapshot of the whole assault configuration — every toggle and parameter, the armed layers and the target level — so a chaos experiment ("slow kitchen", "cave on fire", "500 storm") can be rerun in one click instead of re-clicking a dozen toggles.
-
Save —
Save current as scenarioasks for a name (1 to 64 letters, digits, spaces,-or_) and writes.goblin/scenarios/<name>.jsonin the project directory, in the.goblin-state.jsonformat. Saving under an existing name asks before replacing it. -
Load — replaces the whole configuration by the selected scenario, as a single change. A scenario never holds the active flag: loading one leaves chaos on or off as it is. An invalid value in a hand-edited file falls back to a valid one with a log, as for any other configuration change.
-
Delete — removes the scenario file; the current configuration is not touched.
The section shows what the selected scenario arms, its layers and its level. Unlike the custom profiles, which live in the browser, scenarios are files: they are shared by every browser, survive a cleared browser cache, and are reachable through JSON-RPC and Dev MCP, so an agent can list them and, once the developer enables loadScenario, rerun one.
Add .goblin/ to your .gitignore next to .goblin-state.json, unless you want to share your scenarios with your team: they are plain JSON files, and committing them is a way to version a set of chaos experiments.
|
Driving Goblin from an AI agent
The Dev UI ships a Dev MCP server, so an AI agent can drive Goblin over MCP instead of clicking the dashboard. The Goblin JSON-RPC service is exposed as MCP tools on that server, which is reachable at /q/dev-mcp in dev mode.
The server is opt-in, so nothing is exposed to an agent until you ask for it:
quarkus.dev-mcp.enabled=trueOnce enabled, the tools that only read the state or stop chaos are available to the agent right away. The tools that arm or mutate chaos — the master switch, the assault toggles, the parameter setters, and the two methods that discard the assault history or counters — are disabled: the agent does not see them at all (they are listed, as disabled, only in the Dev MCP tools page of the Dev UI: Settings — the gear icon, top right — then the Dev MCP tab, then Tools), although the descriptions of the read-only tools tell it that they exist. Enable the ones you want the agent to use from that page. Quarkus remembers the choice in ~/.quarkus/dev-mcp.properties, in your home directory: it survives live reloads and restarts, and it applies to every Quarkus application on your machine that uses Goblin, not only to this project. Disable the tools again from the same page when the experiment is over.
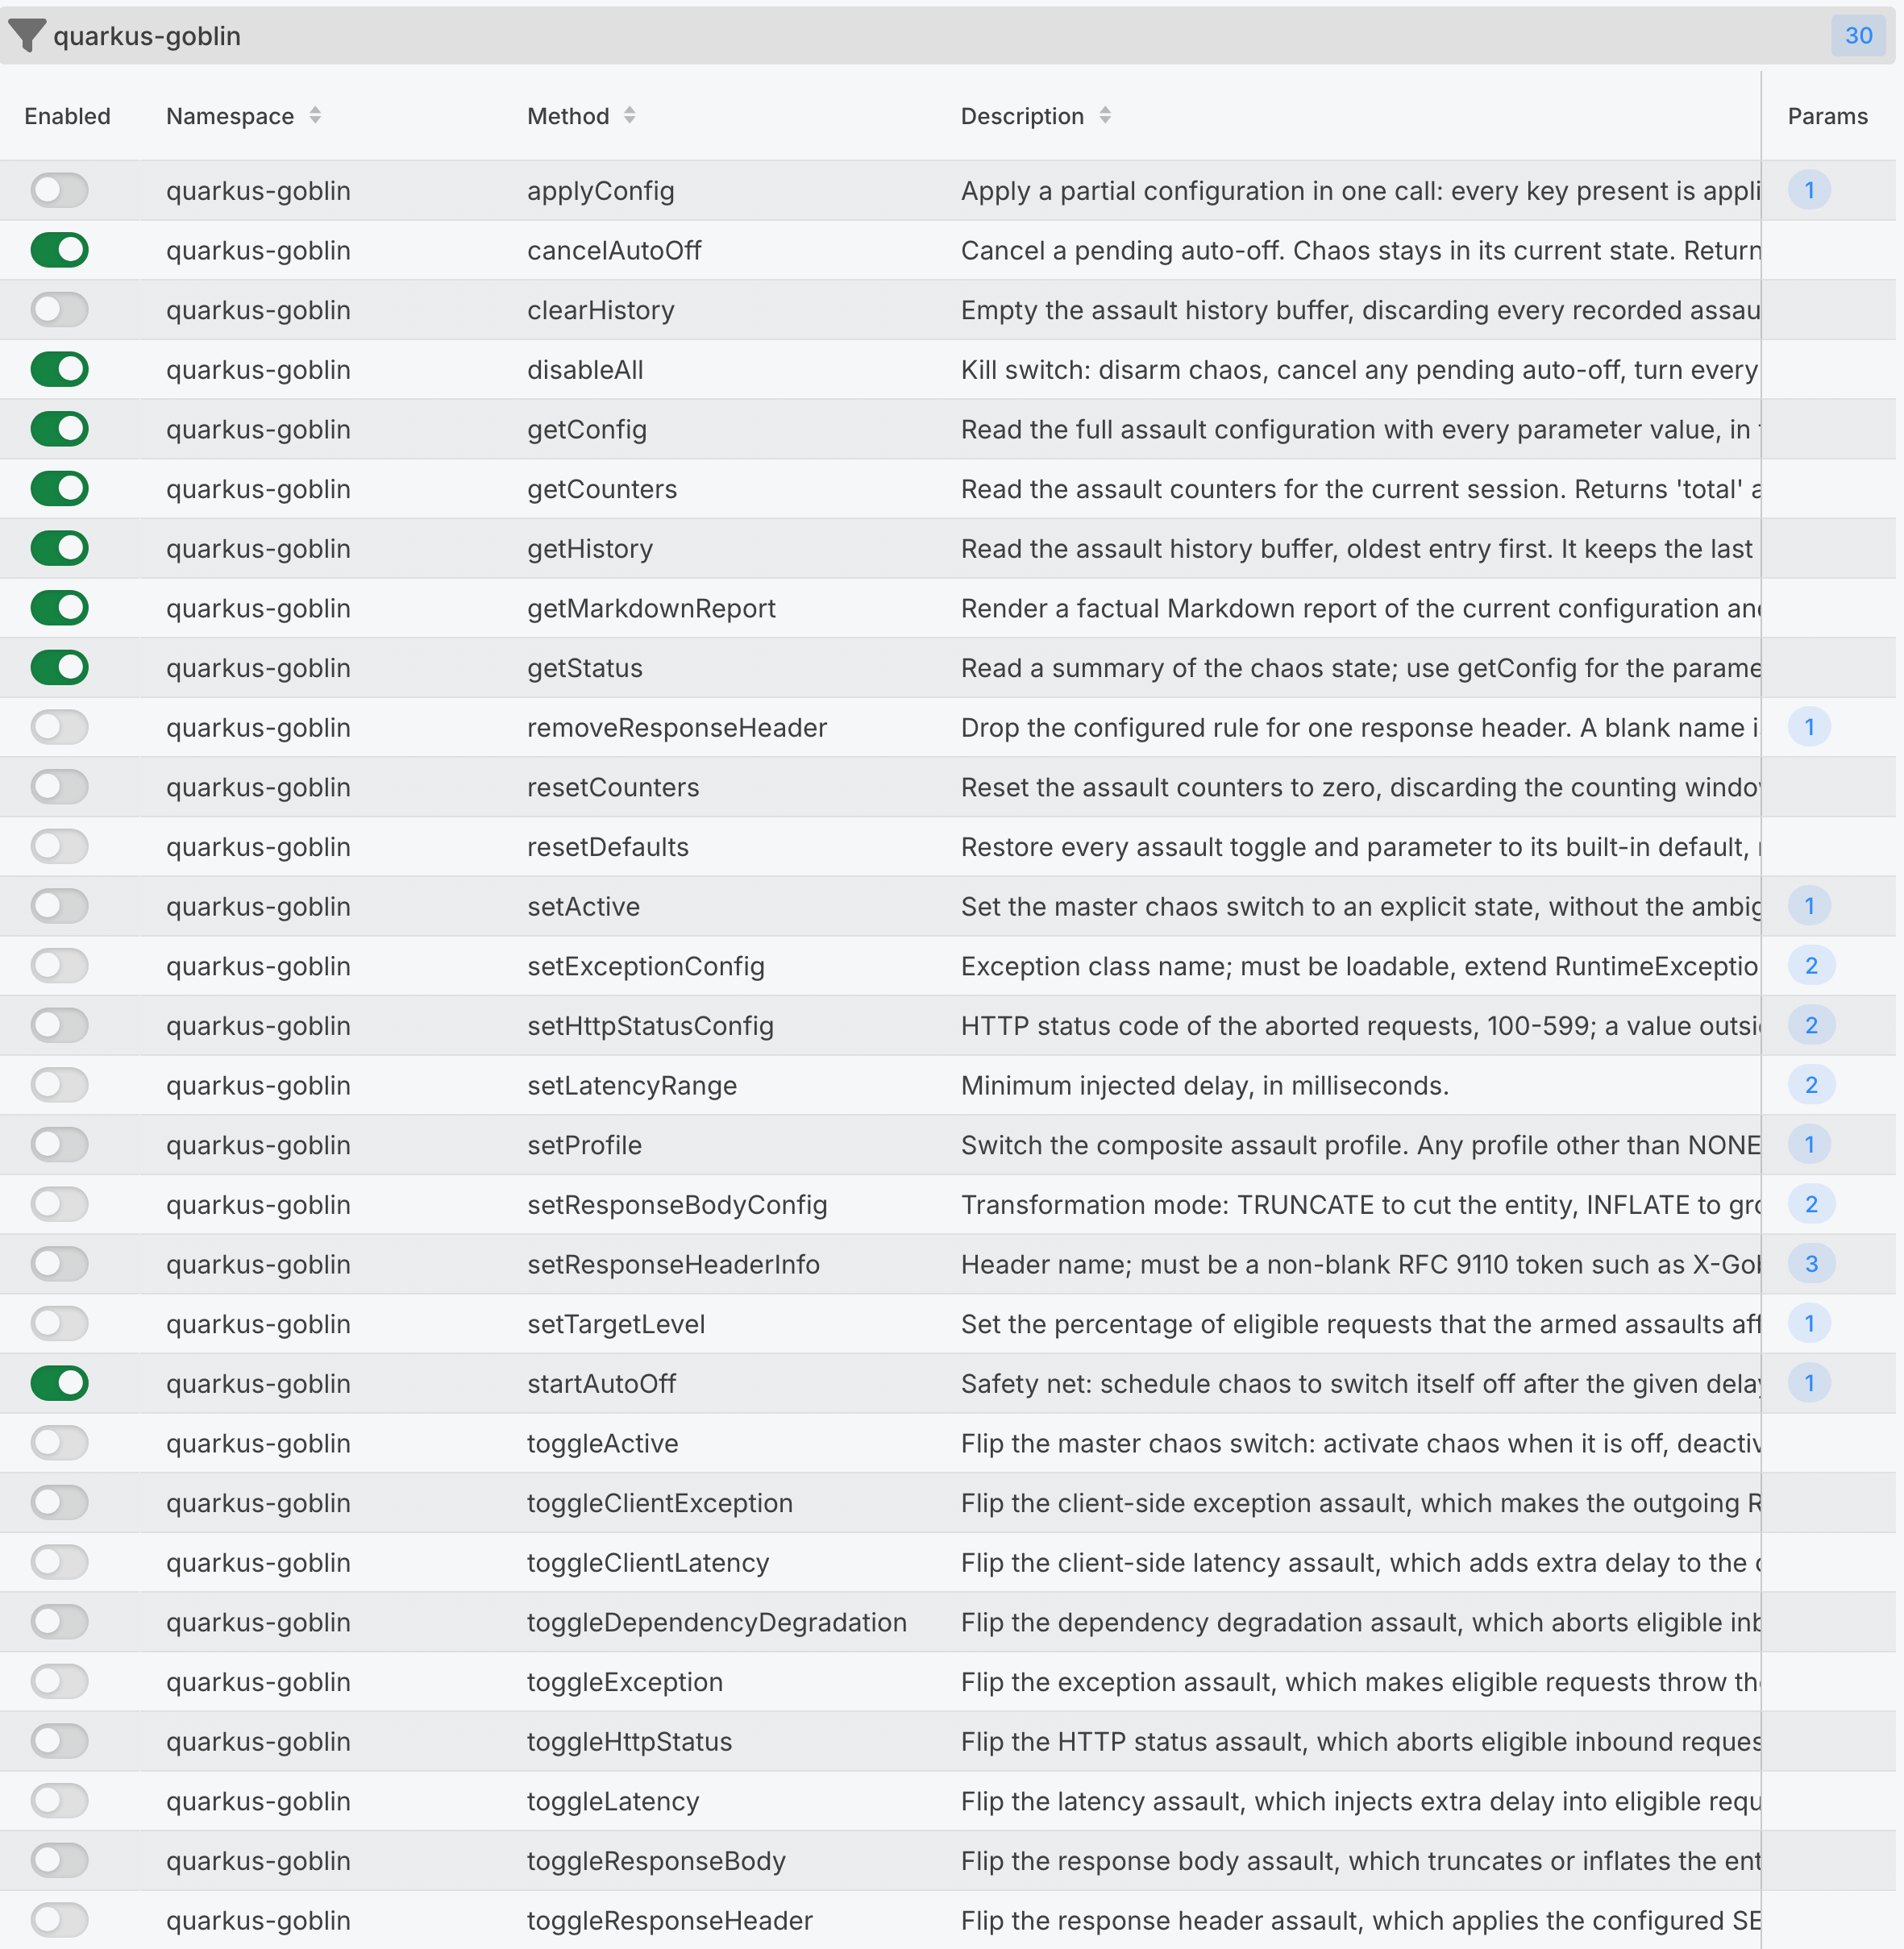
On the agent’s side, only the enabled tools exist. Here is what an MCP client — the MCP Inspector, connected to http://localhost:8080/q/dev-mcp — sees with the default set: the eight read and stop tools, each with the description and the parameters the agent works from.
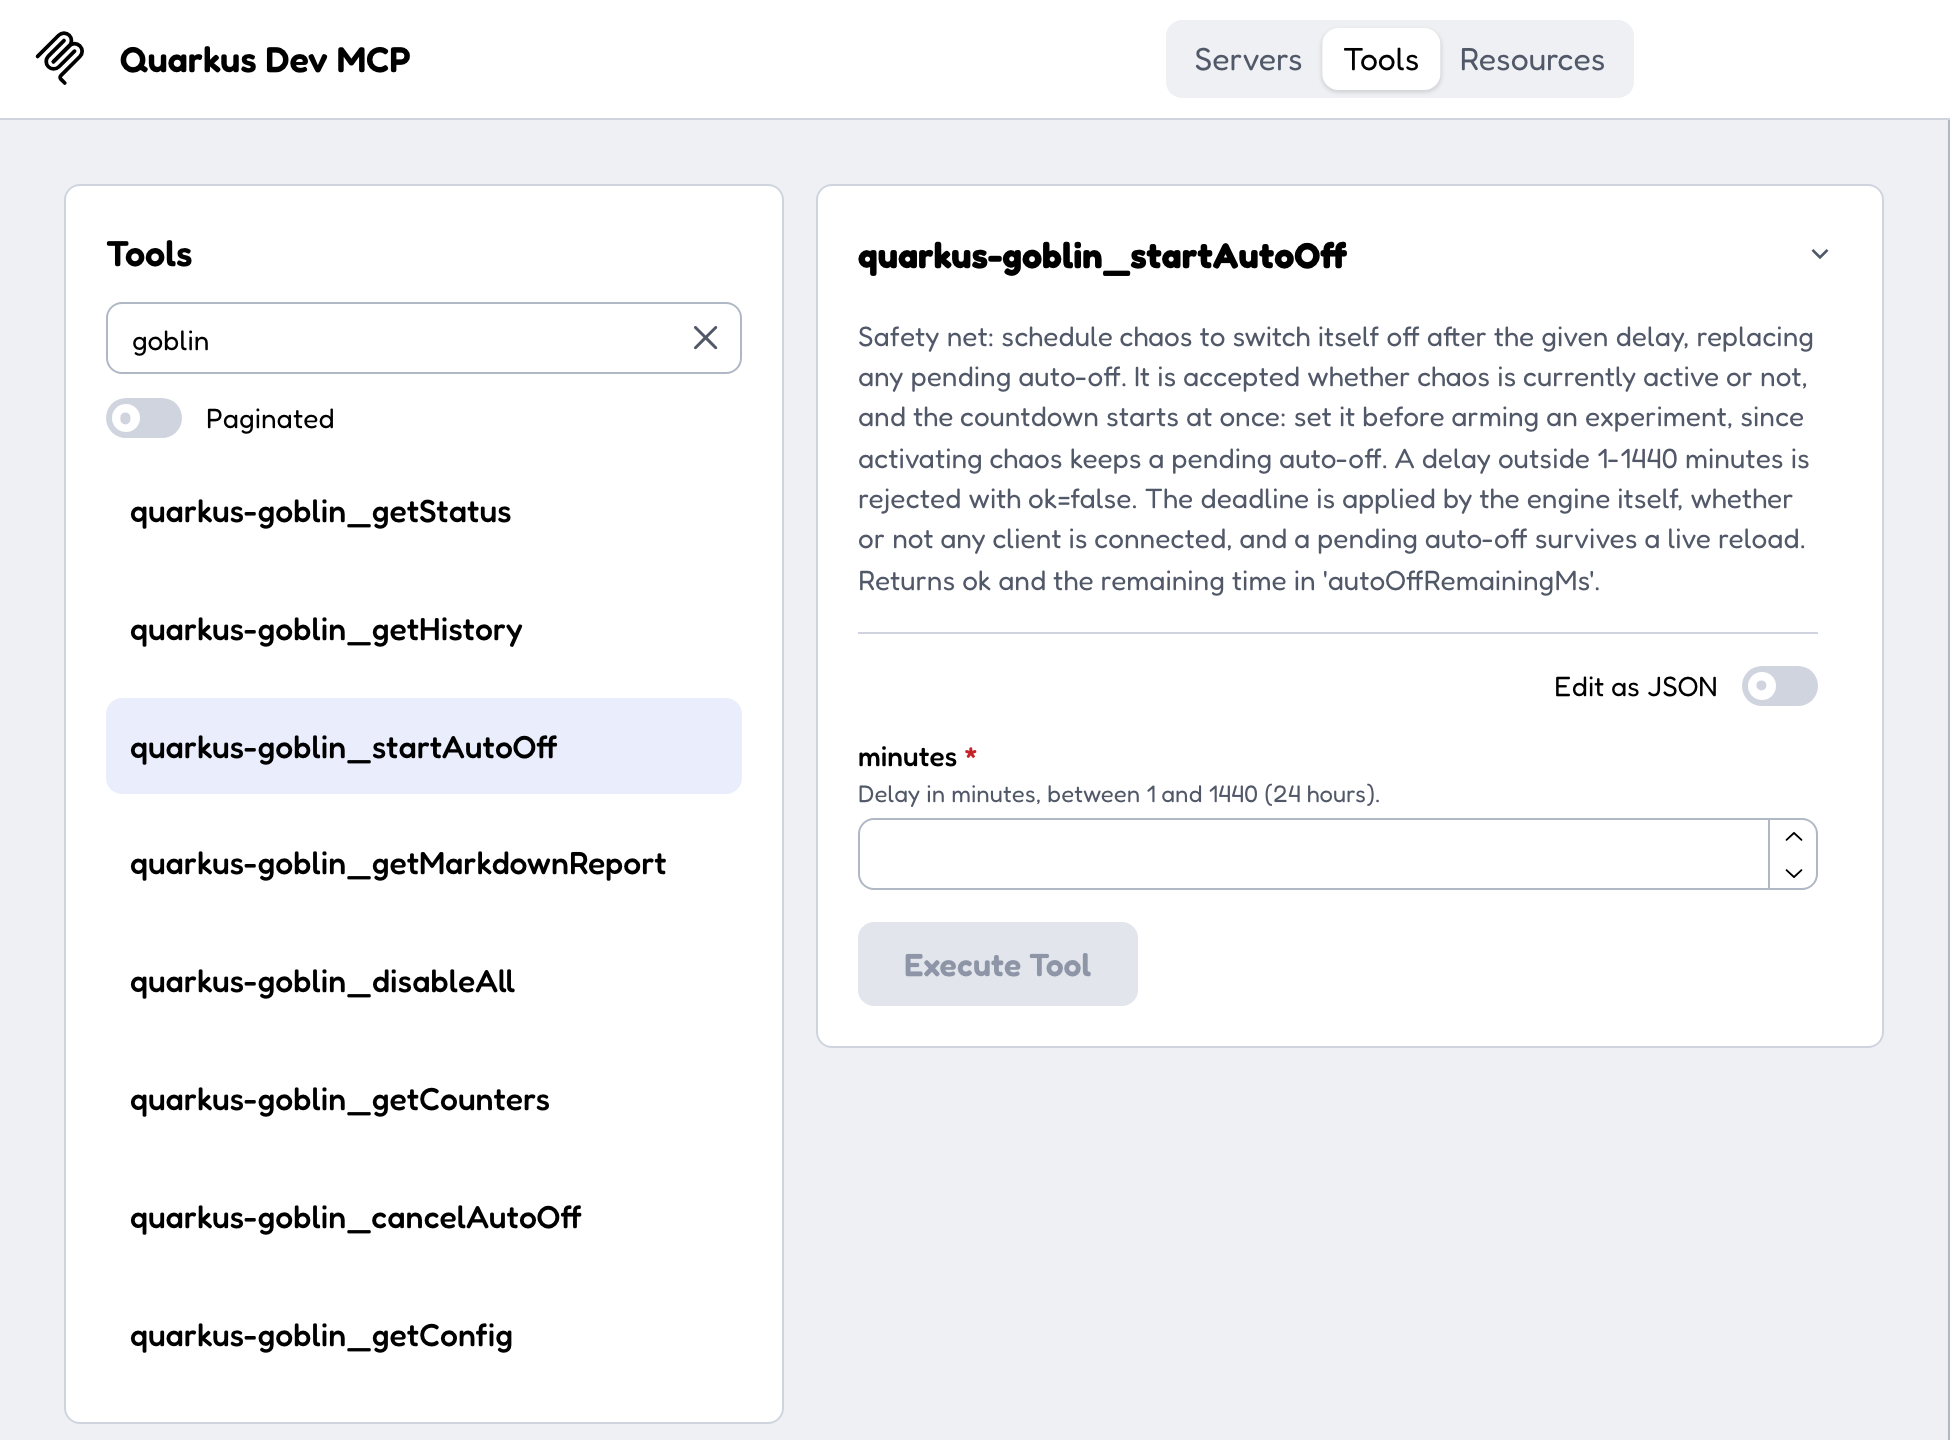
Goblin also serves two Dev MCP resources, enabled by default: quarkus-goblin_agentPlaybook, the safety rules and the experiment loop an agent should follow, and quarkus-goblin_resilienceInventory, the methods your application guards with Fault Tolerance annotations. See Agent playbook.
A typical session goes like this: the agent reads getStatus to see what is armed, calls startAutoOff so the session cannot outlive its own safety net, and only then arms an assault. It reads getHistory, getCounters and getMarkdownReport afterwards to check what actually happened, and calls disableAll to stop everything.
| An agent can reach your application’s endpoints, and enabling the assault tools lets it break them on purpose. The read-only default set is deliberately safe to leave on; keep the armed tools disabled until you have a reason to hand that over. |
Every method, and every parameter of every method, carries a description written for an agent: what the call does, which values it accepts, and what it returns. See Dev MCP exposure for the exact default/opt-in split.
History
The History panel is a live chaos-testing console. It auto-refreshes every 2 seconds while the panel is visible, so new assaults appear as they happen without a manual reload.
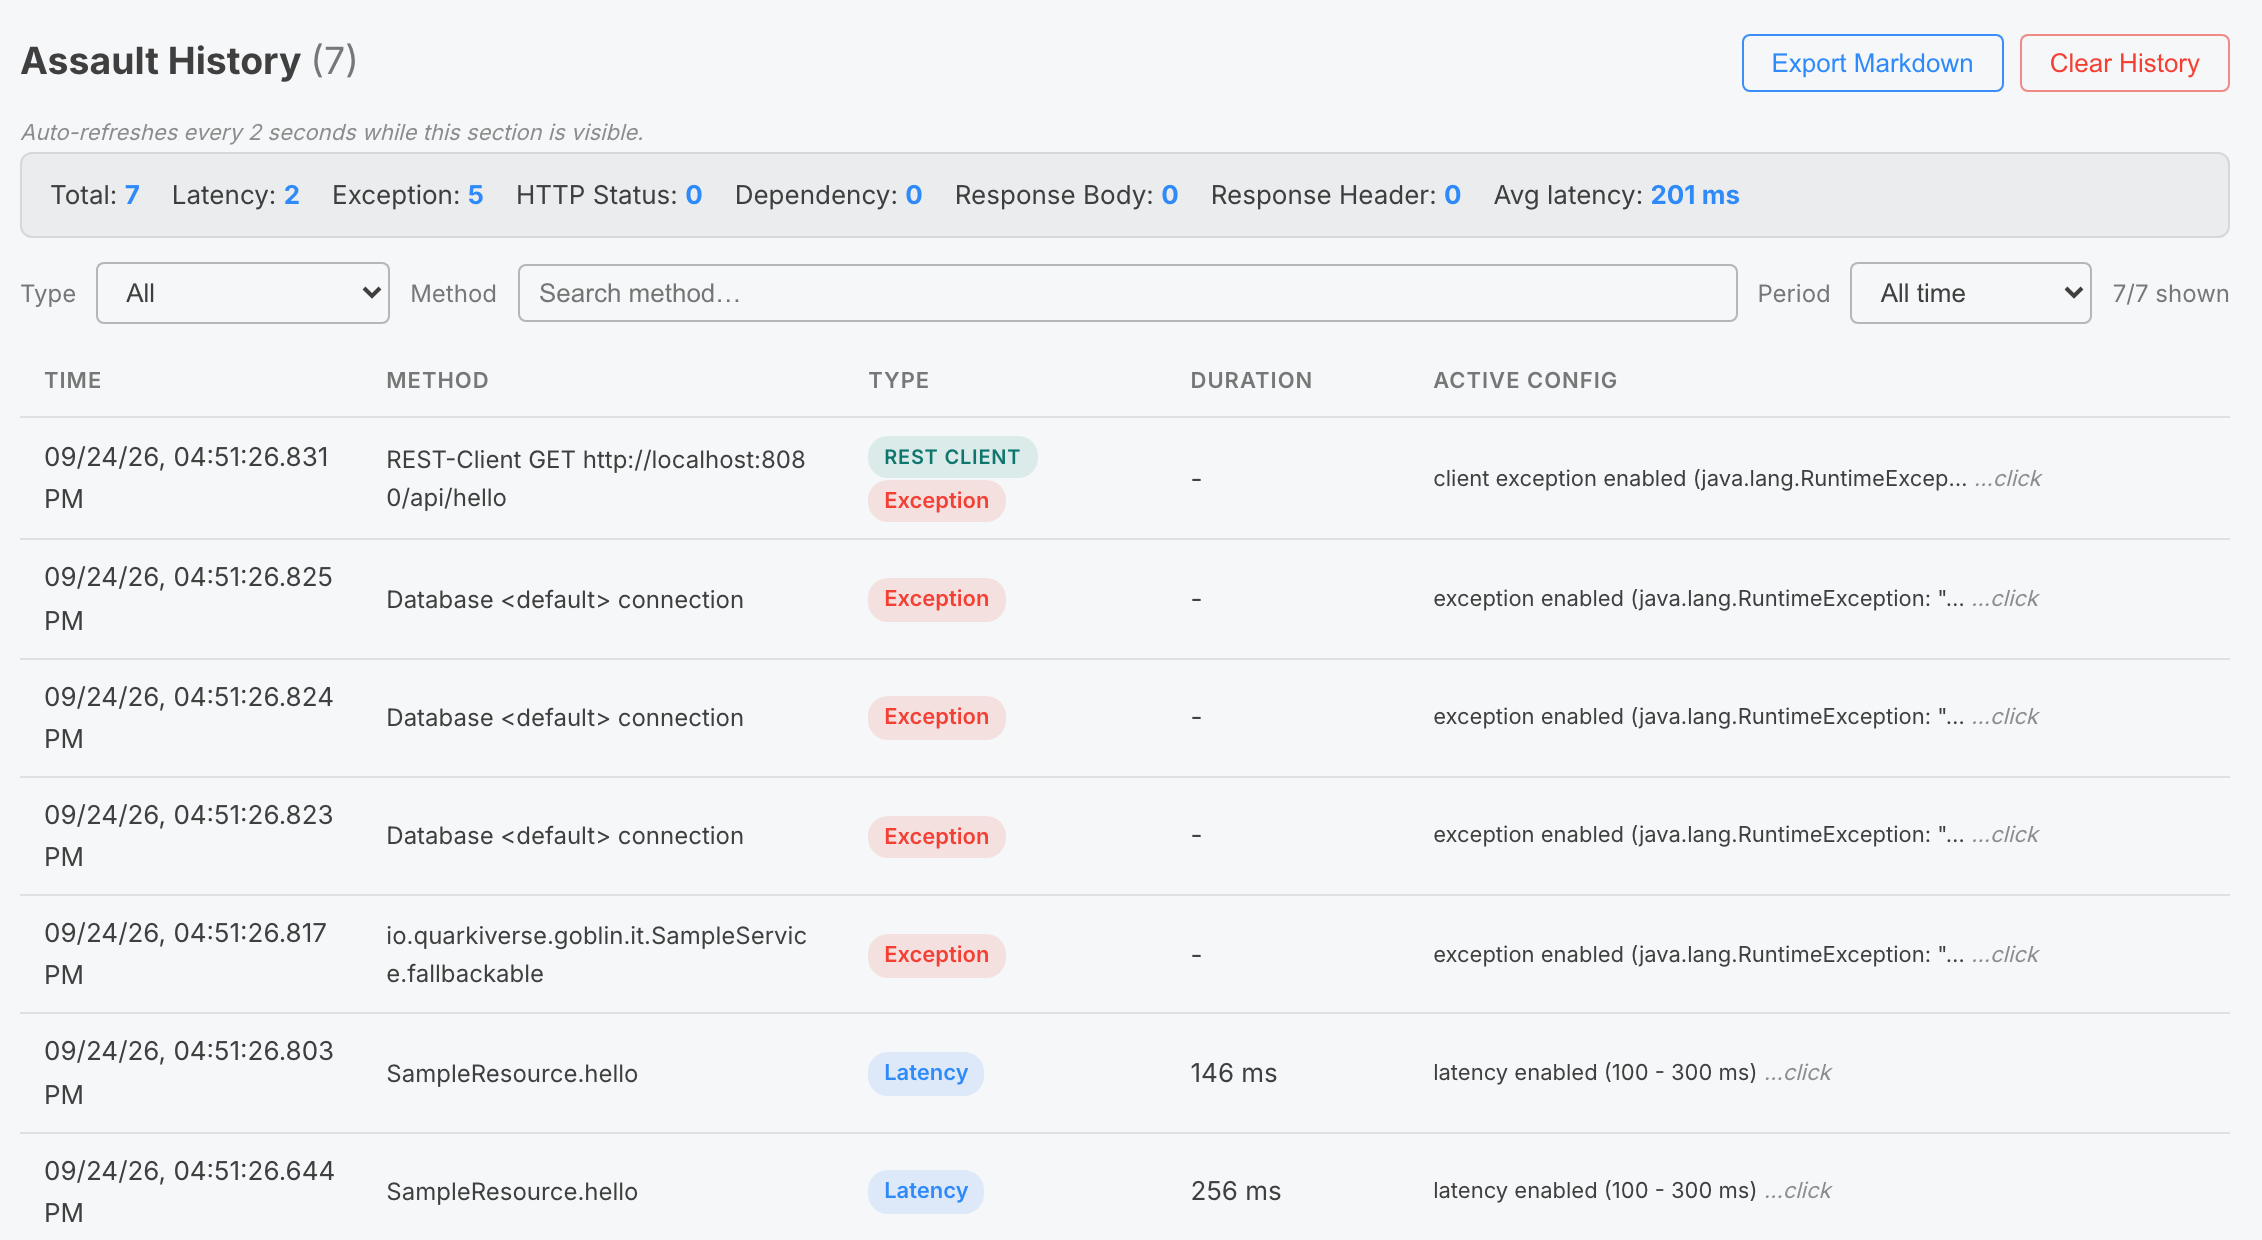
The Assault History panel showing past triggered assaults.
Each row shows:
-
the timestamp of the assault — millisecond precision, with the full ISO timestamp shown on hover
-
the assaulted target: the resource method (
SampleResource.hello), the application bean method (SERVICE),Database <datasource> connection,Messaging <consumer>, or the outgoing call (REST-Client GET <url>,WebClient GET <url>) -
the assault type shown as a colored badge —
Latency,Exception,HTTP Status,Dependency, and for response body assaults two distinct badges depending on the mode:Truncate(response-body-truncate) andInflate(response-body-inflate). Response header rules are shown asHeader Set: <name>/Header Remove: <name> -
the actual applied latency duration when the assault was a latency injection
-
the active assault configuration at the time of the assault, stored compactly in an
Active Configcell — click the cell to expand or collapse it
Newest assaults appear first. A summary band above the table shows the totals per assault type and the average injected latency, updated live (the response body total combines both modes, the response header total combines every header rule).
A filter bar narrows the list: filter by assault type (the Response Body entry groups the truncate and inflate modes, the Response Header entry groups every header rule), by a method text search, or by time period (last 5 minutes, 30 minutes, 1 hour, 24 hours, or all time). The counter shows how many of the total assaults match the current filters.
The history is an in-memory buffer capped at the latest 1000 assaults. Use it to confirm that your targeting rules and level are applying to the expected endpoints before drawing conclusions about your resilience checks. Clear History wipes the buffer between test sessions — the first click arms the button, a second click within 3 seconds performs the clear.
Markdown report export
The History panel also offers an Export Markdown button. Clicking it generates a factual Markdown report of the current Goblin session and displays it in a panel with Copy and Download actions:
-
the current status (active/inactive) and target level
-
the current assault configuration (active profile, armed chaos layers, latency, exception, HTTP status, dependency degradation, response body toggles and values, response header rules, client-side assault toggles)
-
the full assault history, including the source of each assault (
server,service,database,messaging,rest-client,webclient), the actual latency duration applied for each latency assault and a snapshot of the active configuration at the time of each assault — so a config change between two calls is clearly visible (e.g.latency enabled (100 - 500 ms)vslatency enabled (1000 - 5000 ms))
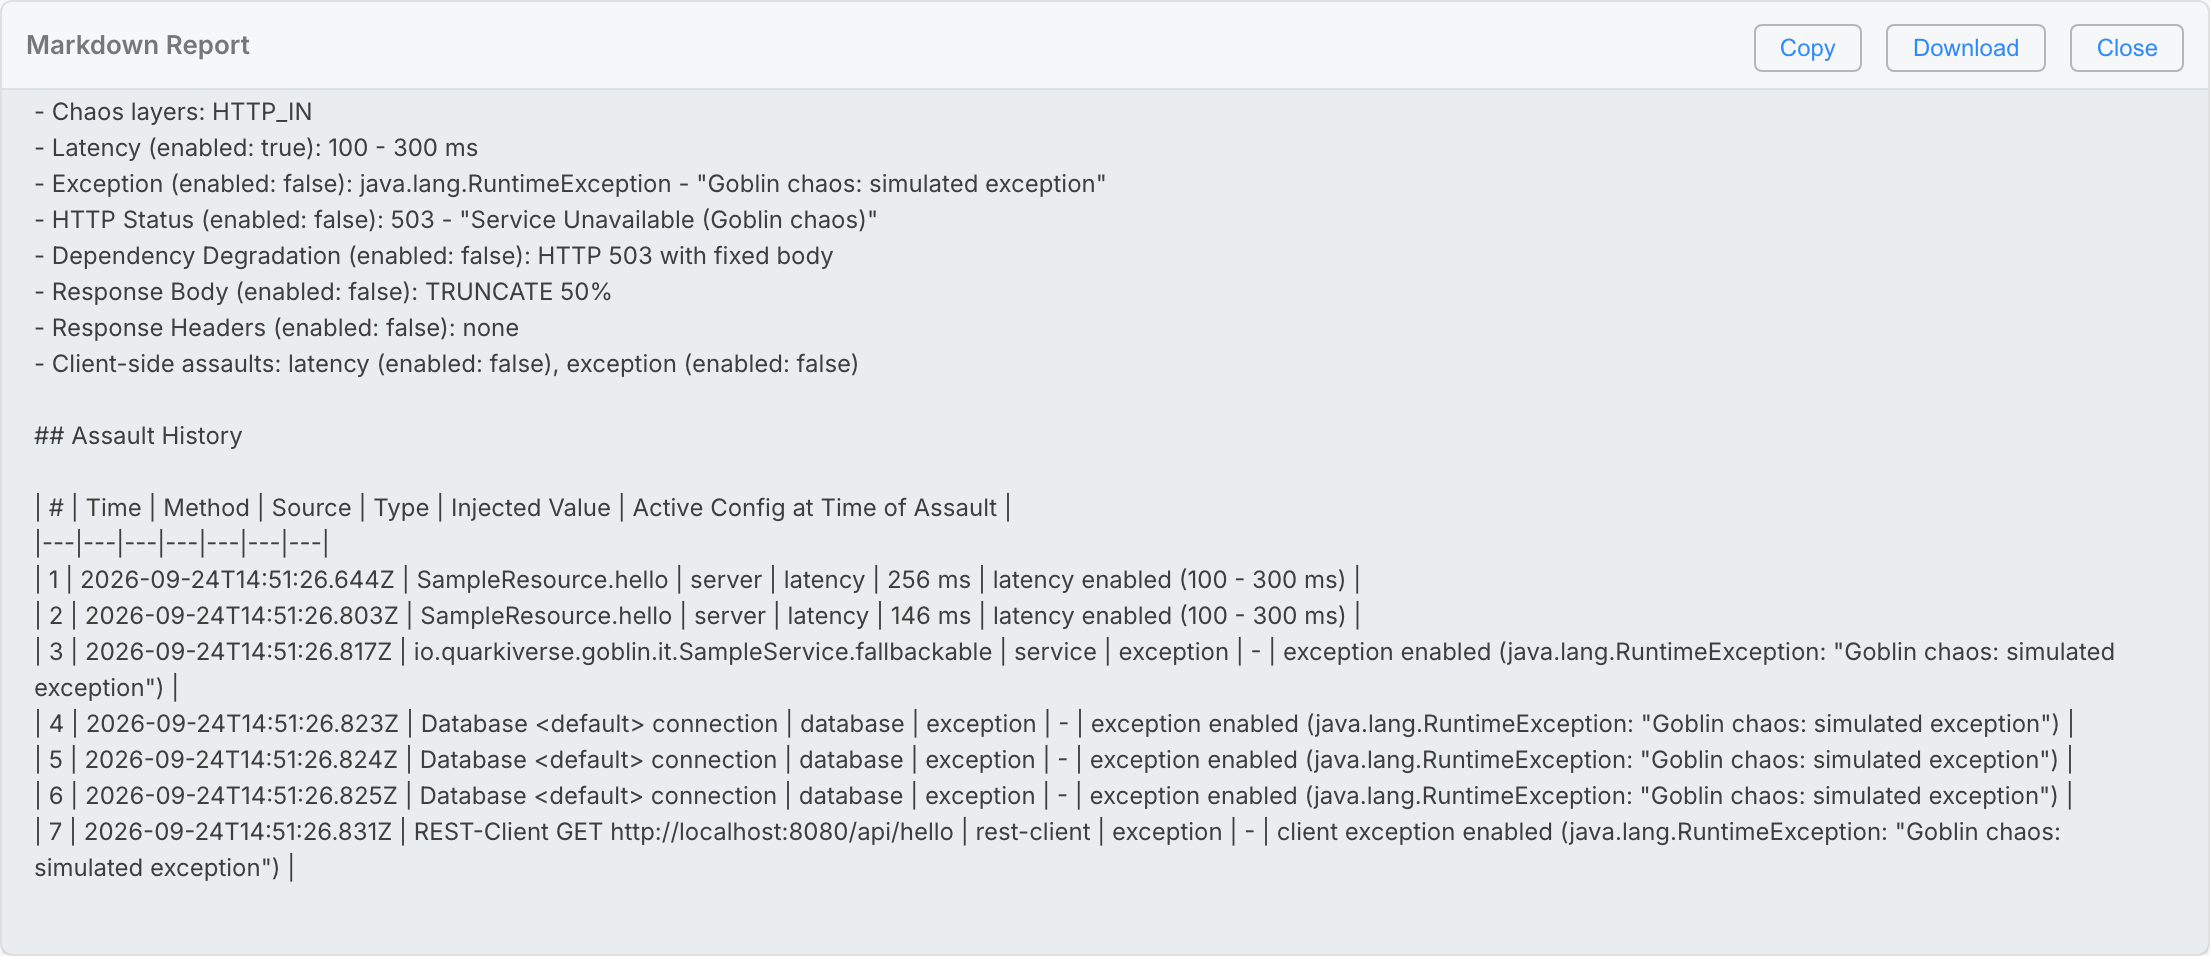
The exported Markdown report with the assault history table.
The report is intentionally factual: it records what Goblin observed (configuration and assault history), without judging your application’s resilience. This makes it directly usable as input for an LLM assistant tasked with reviewing and hardening your endpoints — the facts ("`GET /api/orders` was subject to a 4945 ms latency at 10:37 UTC") are there, the verdict is left to the reviewer.