Performance Benchmark
Quarkus Flow performance depends on two independent dimensions:
-
Workflow dimension: what is stressed
-
Persistence strategy: how workflow state is stored
This page summarizes representative benchmark results for common workflow reference models and persistence types. The goal is to make the main performance trade-offs visible in a simple way.
Benchmark model
The benchmark suite is organized as a matrix.
| Workflow dimension | None | File | Redis | Valkey | JPA |
|---|---|---|---|---|---|
Task Orchestration |
yes |
yes |
yes |
yes |
yes |
TaskOutput Processing |
yes |
yes |
yes |
yes |
yes |
TaskOutput Handling |
yes |
yes |
yes |
yes |
yes |
External Call |
yes |
yes |
yes |
yes |
yes |
Workflow dimensions
| Dimension | What is stressed |
|---|---|
Task Orchestration |
Workflows with a high number of tasks and small TaskOutput. |
TaskOutput Processing |
CPU-heavy workflows that generate and transform TaskOutput. |
TaskOutput Handling |
Large prebuilt TaskOutput, emphasizing serialization and backend throughput. |
External Call |
Workflows dominated by downstream HTTP external calls latency. |
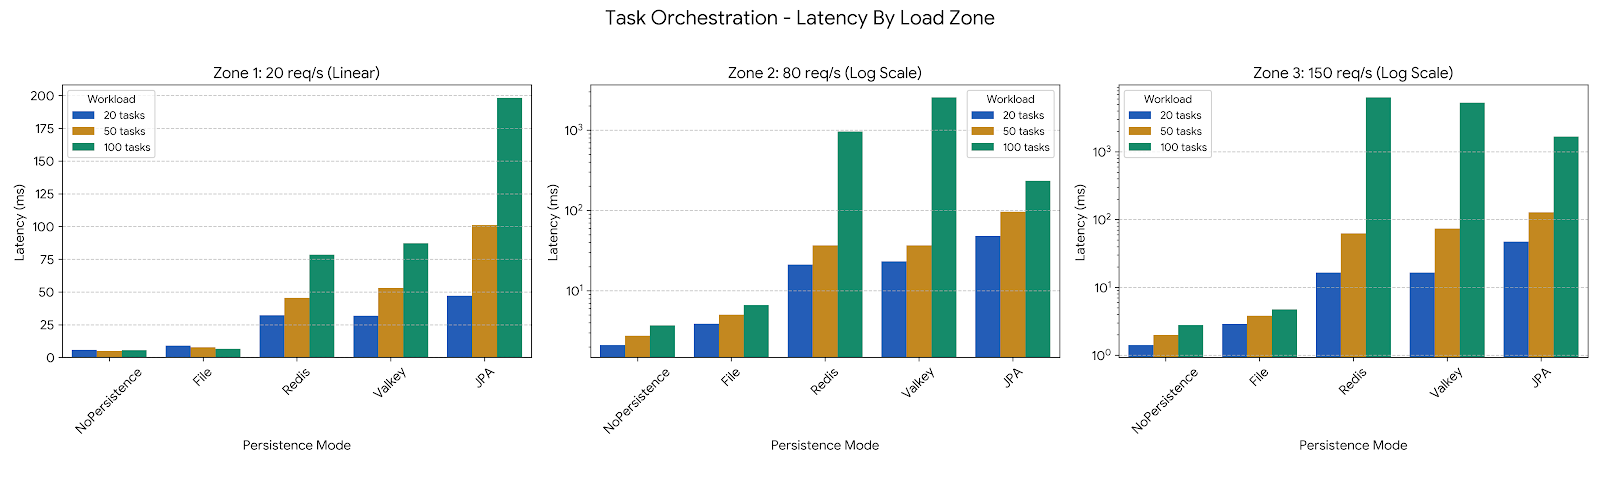
Task Orchestration
Task Orchestration stresses workflows with a high number of tasks and small TaskOutput. The main question is how persistence affects latency as request rate increases.
-
At low load (linear scale) the performance differences between the high-efficiency persistence modes (NoPersistence, File) and JPA, Redis, and Valkey are minimal.
-
In Redis and Valkey, the latency cost per task remains manageable at 20 req/s but explodes as the load hits 150 req/s, especially for the 100-step workflow.
-
At medium load and high load (logarithmic scale on the Y-axis to make the chart readable) Redis and Valkey exhibit massive latency spikes (RTT-induced delay exceeds the time between incoming requests), while NoPersistence and File modes remain stable at sub-10ms ranges. JPA performs better than Redis/Valkey at 80 req/s (only 17 drops), due to efficient connection pooling.
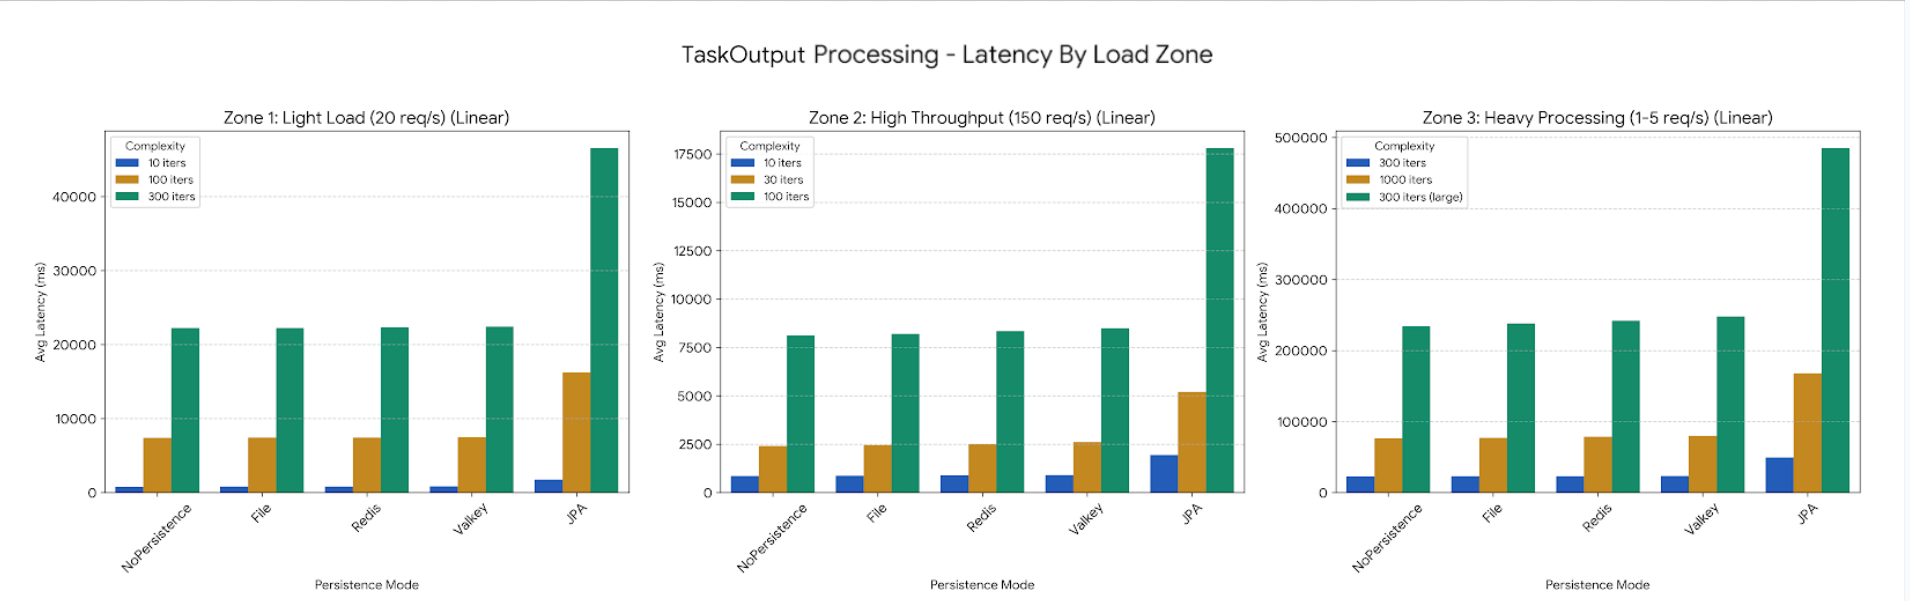
TaskOutput Processing
TaskOutput Processing stresses CPU-heavy workflows that generate and transform TaskOutput.
-
CPU work (iterations over items and serialization) consumes the bulk of the time. Since NoPersistence, File, Redis, and Valkey all have extremely low overhead for state management, they are all waiting on the same CPU-bound task to finish.
-
JPA is the only one that stands out significantly because its overhead for managing the persistence context and database transactions is high enough to be visible even in a low load scenario: it is consistently around 2x slower than the others.
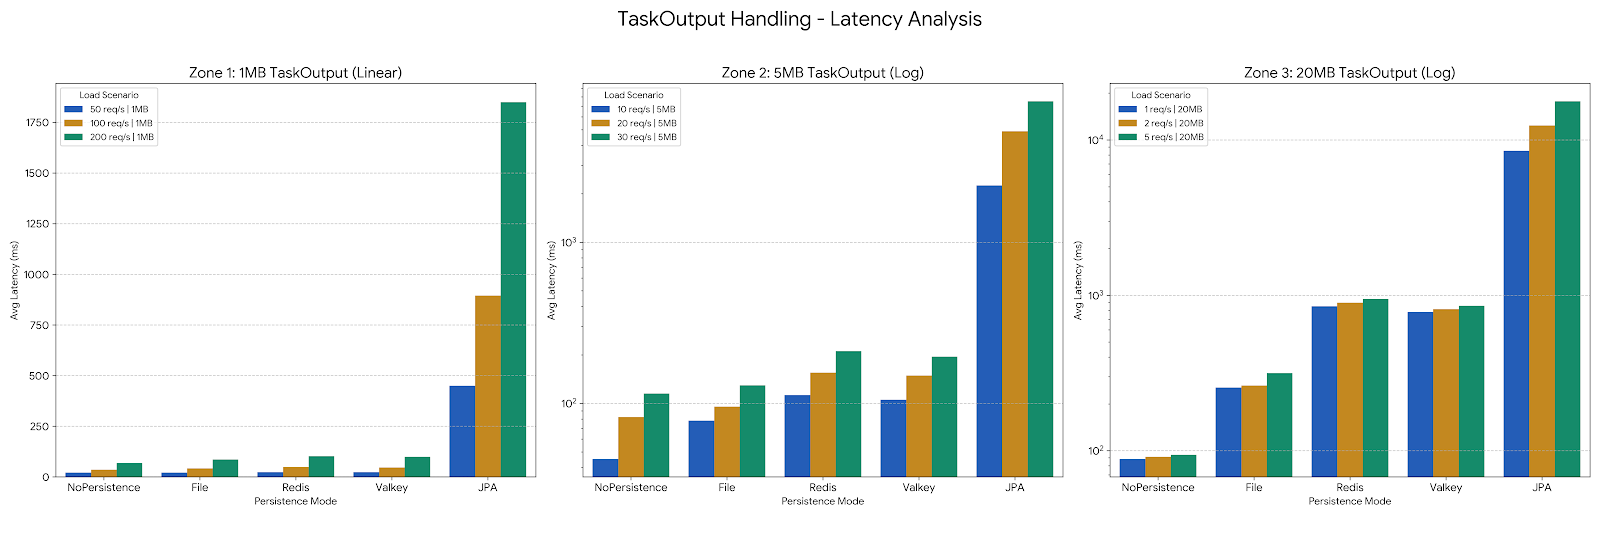
TaskOutput Handling
TaskOutput Handling isolates large prebuilt TaskOutput and emphasizes serialization and backend bandwidth.
-
Zone 1 (1MB): All modes except JPA maintain very low latency (under 100ms). JPA shows significantly higher overhead even with 1MB files due to the serialization/deserialization into the database.
-
Zone 2 (5MB): As the output size grows to 5MB, the difference between NoPersistence/File and Redis/Valkey begins to widen. Redis and Valkey start showing the cost of network transfer for larger payloads.
-
Zone 3 (20MB): At 20MB, the latency for JPA spikes dramatically, reaching nearly 18 seconds at 5 req/s. Redis and Valkey also see substantial increases (approaching 1 second) while NoPersistence remains the most efficient, as it bypasses the write/read overhead entirely.
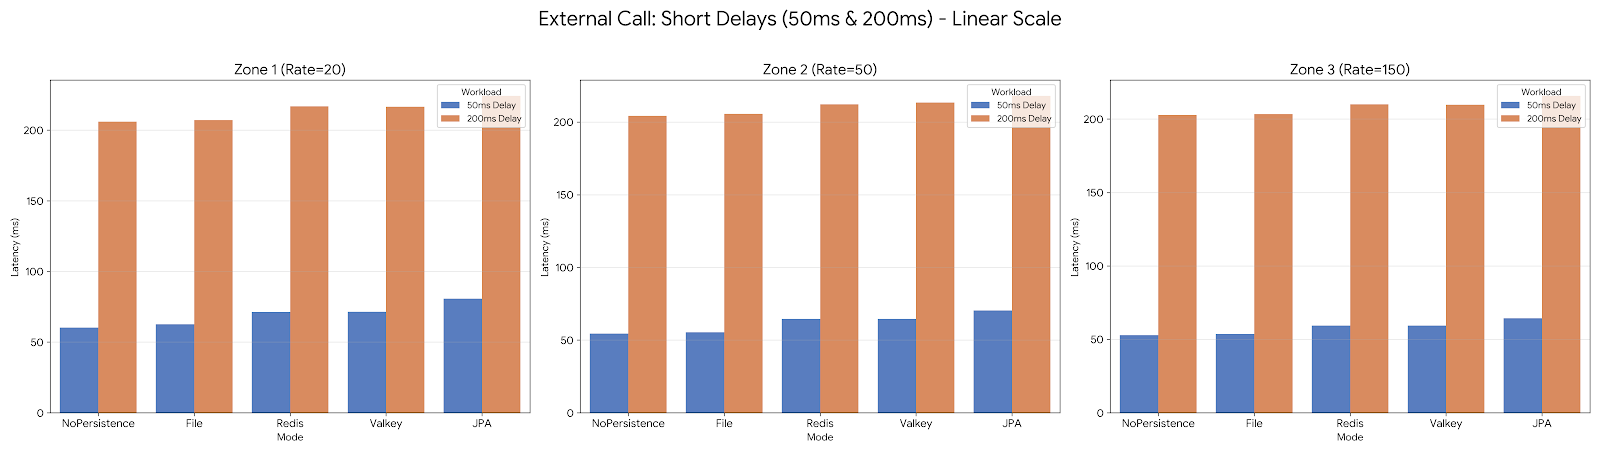
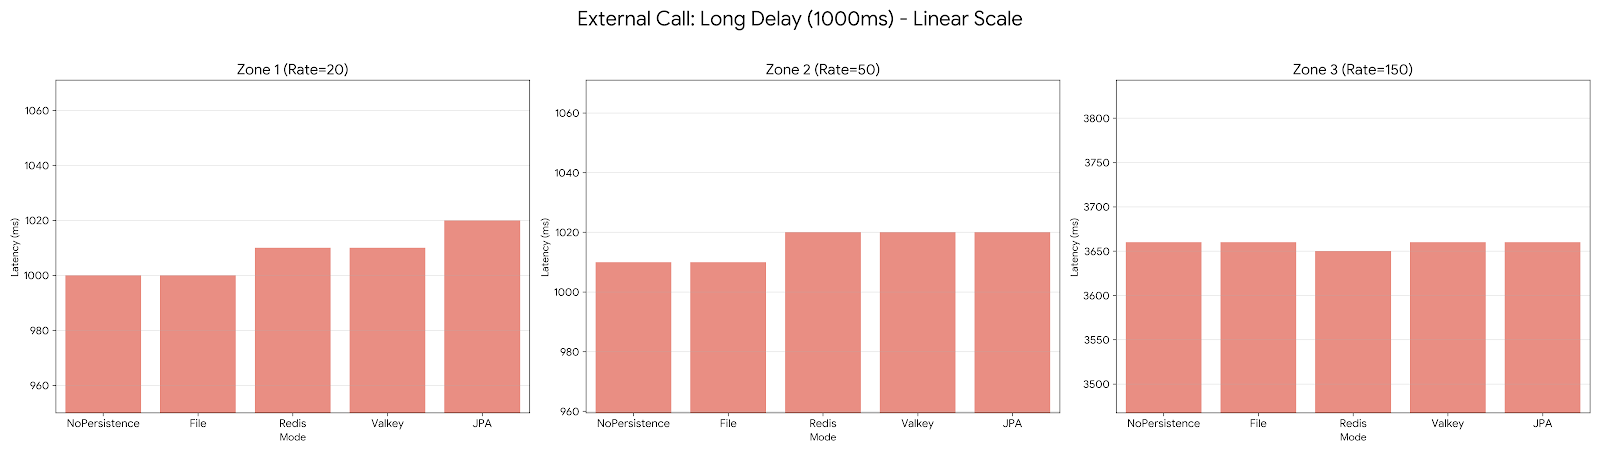
External Call
External Call benchmarks isolate workflows dominated by HTTP latency.
-
Dominant External Delay: In Zones 1 and 2, the latency is almost identical to the injected delay. For example, in the 1000ms delay scenario, all modes hover around 1000-1020ms.
-
Saturation in Zone 3: When reaching 150 req/s with a 1000ms delay, the system hits a significant bottleneck. Latencies jump from 1000ms to around 3660ms across all modes. This indicates that the worker pool or connection limits are saturated, causing requests to queue regardless of the persistence mode used.
-
Orchestration Overhead: At lower delays (50ms), we can see the relative overhead of the modes. JPA consistently adds about 10–20ms of additional latency compared to NoPersistence, while Redis and Valkey sit in the middle with around 10ms of overhead.
How to read the charts
Each chart is divided into three load zones:
-
Zone 1: low load
-
Zone 2: medium load
-
Zone 3: high load / saturation
The charts compare the same executions across persistence modes so the visual differences reflect the persistence strategy rather than a different workflow shape.
Methodology
These results were generated with:
-
JVM mode
-
k6 constant-arrival-rate scenarios
-
30-second runs
-
http_req_duration avgas the main latency metric
The benchmark suite is intended to show relative behavior and scaling trends. Results will vary with hardware, JVM tuning, backend configuration, data size, and container runtime conditions.
Notes
These results are representative benchmark results, not universal guarantees. For reproducibility and raw benchmark logs, see the generated result files used to build the charts.