Observability with Prometheus and Micrometer
Quarkus Flow instruments workflow executions using Micrometer, the metrics facade integrated into Quarkus. It records meters for execution counts, durations, and runtime states.
Because the instrumentation is registry-agnostic, Quarkus Flow does not depend on Prometheus directly: the same meters can be exported to any Micrometer-supported backend. This guide uses the Prometheus registry, the most common choice, which pairs naturally with Grafana for visualization and alerting.
Configuring Observability
Quarkus Flow provides an out-of-the-box observability setup.
To enable it, add the following dependency to your project:
<dependency>
  <groupId>io.quarkus</groupId>
  <artifactId>quarkus-micrometer-registry-prometheus</artifactId>
</dependency>
Once the dependency is added, workflow metrics are automatically exposed through the Prometheus endpoint. No additional configuration is required.
|
You can disable workflow metrics either by removing the |
|
Metric names are aligned with the workflow state phases defined in the CNCF Serverless Workflow specification: https://github.com/serverlessworkflow/specification/blob/main/dsl.md#status-phases |
|
Prometheus is only one of the registries that Micrometer supports.
Since Quarkus Flow records its meters through Micrometer rather than depending on Prometheus,
you can export the same metrics to a different backend by swapping the registry — for example,
through the Micrometer-to-OpenTelemetry bridge (the The metric names and tags described in this guide stay the same regardless of the registry; only their on-the-wire representation changes. |
Counting workflow events
Workflow metrics allow you to answer questions such as:
-
How many workflows have started?
-
How many workflows have completed successfully?
-
How many workflows have failed or been cancelled?
-
How many task executions have occurred?
Below is the complete list of counter metrics emitted by Quarkus Flow to track workflow and task execution events.
| Metric name | Description | Type | Tags | Prometheus example |
|---|---|---|---|---|
|
Total number of workflows started |
Counter |
|
|
|
Total number of workflows completed |
Counter |
|
|
|
Total number of workflows faulted |
Counter |
|
|
|
Total number of workflows cancelled |
Counter |
|
|
|
Total number of tasks started |
Counter |
|
|
|
Total number of tasks completed |
Counter |
|
|
|
Total number of task retries |
Counter |
|
|
|
Total number of tasks failed |
Counter |
|
|
What is happening now?
Quarkus Flow also exposes gauge metrics that represent the current state of workflow executions. These metrics answer questions such as:
-
How many workflows are currently running?
-
How many workflows are waiting for an event or timer?
-
How many workflows are suspended?
Below is the list of gauge metrics emitted by Quarkus Flow.
| Metric name | Description | Type | Tags | Prometheus example |
|---|---|---|---|---|
|
Number of workflow instances currently running |
Gauge |
|
|
|
Number of workflow instances currently waiting |
Gauge |
|
|
|
Number of workflow instances currently suspended |
Gauge |
|
|
How long did a workflow or task take to complete?
Workflow and task durations are exported using Micrometer Timers.
| Metric name | Description | Type | Tags |
|---|---|---|---|
|
Duration of workflow executions |
Timer |
|
|
Duration of task executions |
Timer |
|
Example configuration in application.properties:
quarkus.flow.metrics.durations.enabled=true
quarkus.flow.metrics.durations.percentiles=0.5,0.95,0.99
With this configuration:
-
Client-side percentiles are exported as
quantiletime series -
Histogram buckets are exported as
_bucketmetrics
|
The Micrometer Timer always records its base statistics (count, total time, and max),
regardless of the Setting |
Example output from /q/metrics:
# TYPE quarkus_flow_workflow_duration_seconds histogram

# Client-side percentiles (workflow)
quarkus_flow_workflow_duration_seconds{workflow="wait-event",workflowVersion="1.0.0",quantile="0.5"} 14.49
quarkus_flow_workflow_duration_seconds{workflow="wait-event",workflowVersion="1.0.0",quantile="0.95"} 14.49
quarkus_flow_workflow_duration_seconds{workflow="wait-event",workflowVersion="1.0.0",quantile="0.99"} 14.49

# Histogram buckets (workflow)
quarkus_flow_workflow_duration_seconds_bucket{workflow="wait-event",workflowVersion="1.0.0",le="0.001"} 0
quarkus_flow_workflow_duration_seconds_bucket{workflow="wait-event",workflowVersion="1.0.0",le="0.002"} 0

# TYPE quarkus_flow_task_duration_seconds histogram

# Client-side percentiles (task)
quarkus_flow_task_duration_seconds{workflow="simple-workflow",task="getPet",workflowVersion="1.0.0",quantile="0.5"} 0.12
quarkus_flow_task_duration_seconds{workflow="simple-workflow",task="getPet",workflowVersion="1.0.0",quantile="0.95"} 0.15
quarkus_flow_task_duration_seconds{workflow="simple-workflow",task="getPet",workflowVersion="1.0.0",quantile="0.99"} 0.18

# Histogram buckets (task)
quarkus_flow_task_duration_seconds_bucket{workflow="simple-workflow",task="getPet",workflowVersion="1.0.0",le="0.001"} 0
quarkus_flow_task_duration_seconds_bucket{workflow="simple-workflow",task="getPet",workflowVersion="1.0.0",le="0.002"} 0
Fault Tolerance Metrics
Quarkus Flow HTTP calls integrate with SmallRye Fault Tolerance to provide resilience and fault tolerance capabilities. Quarkus Flow exports metrics for Retry and Circuit Breaker strategies.
Retry Metrics
Retry metrics are exported as counters:
| Metric name | Description | Type | Tags | Prometheus example |
|---|---|---|---|---|
|
Total number of retry attempts |
Counter |
|
|
|
Total number of failed retry attempts |
Counter |
|
|
Circuit Breaker Metrics
Circuit Breaker metrics are exported as counters and gauges:
| Metric name | Description | Type | Tags | Prometheus example |
|---|---|---|---|---|
|
Indicates whether the circuit breaker is currently in the OPEN state.
The value is |
Gauge |
|
|
|
Indicates whether the circuit breaker is currently in the CLOSED state.
The value is |
Gauge |
|
|
|
Indicates whether the circuit breaker is currently in the HALF_OPEN state.
The value is |
Gauge |
|
|
|
Total number of calls prevented because the circuit breaker was OPEN. |
Counter |
|
|
|
Total number of failed executions recorded by the circuit breaker. |
Counter |
|
|
Best practices
Name your tasks
If a task does not have an explicit name, Serverless Workflow automatically assigns a UUID as the task name.
That UUID is then used as the task label in metrics, making monitoring and aggregation difficult.
Always provide descriptive task names to ensure meaningful metrics.
Make task names unique
The Serverless Workflow specification does not require task names to be unique within a workflow. When multiple tasks share the same name, their metrics are aggregated under the same label.
Quarkus Flow uses the combination of workflow name (workflow) and task name (task) as metric labels.
Using unique task names improves filtering, aggregation, and dashboard visualization.
Observability DevServices
Quarkus provides the Observability DevServices extension, which automatically starts a complete observability stack during development, including:
-
Prometheus
-
Grafana
-
Loki
-
Tempo
-
Mimir
-
OpenTelemetry Collector
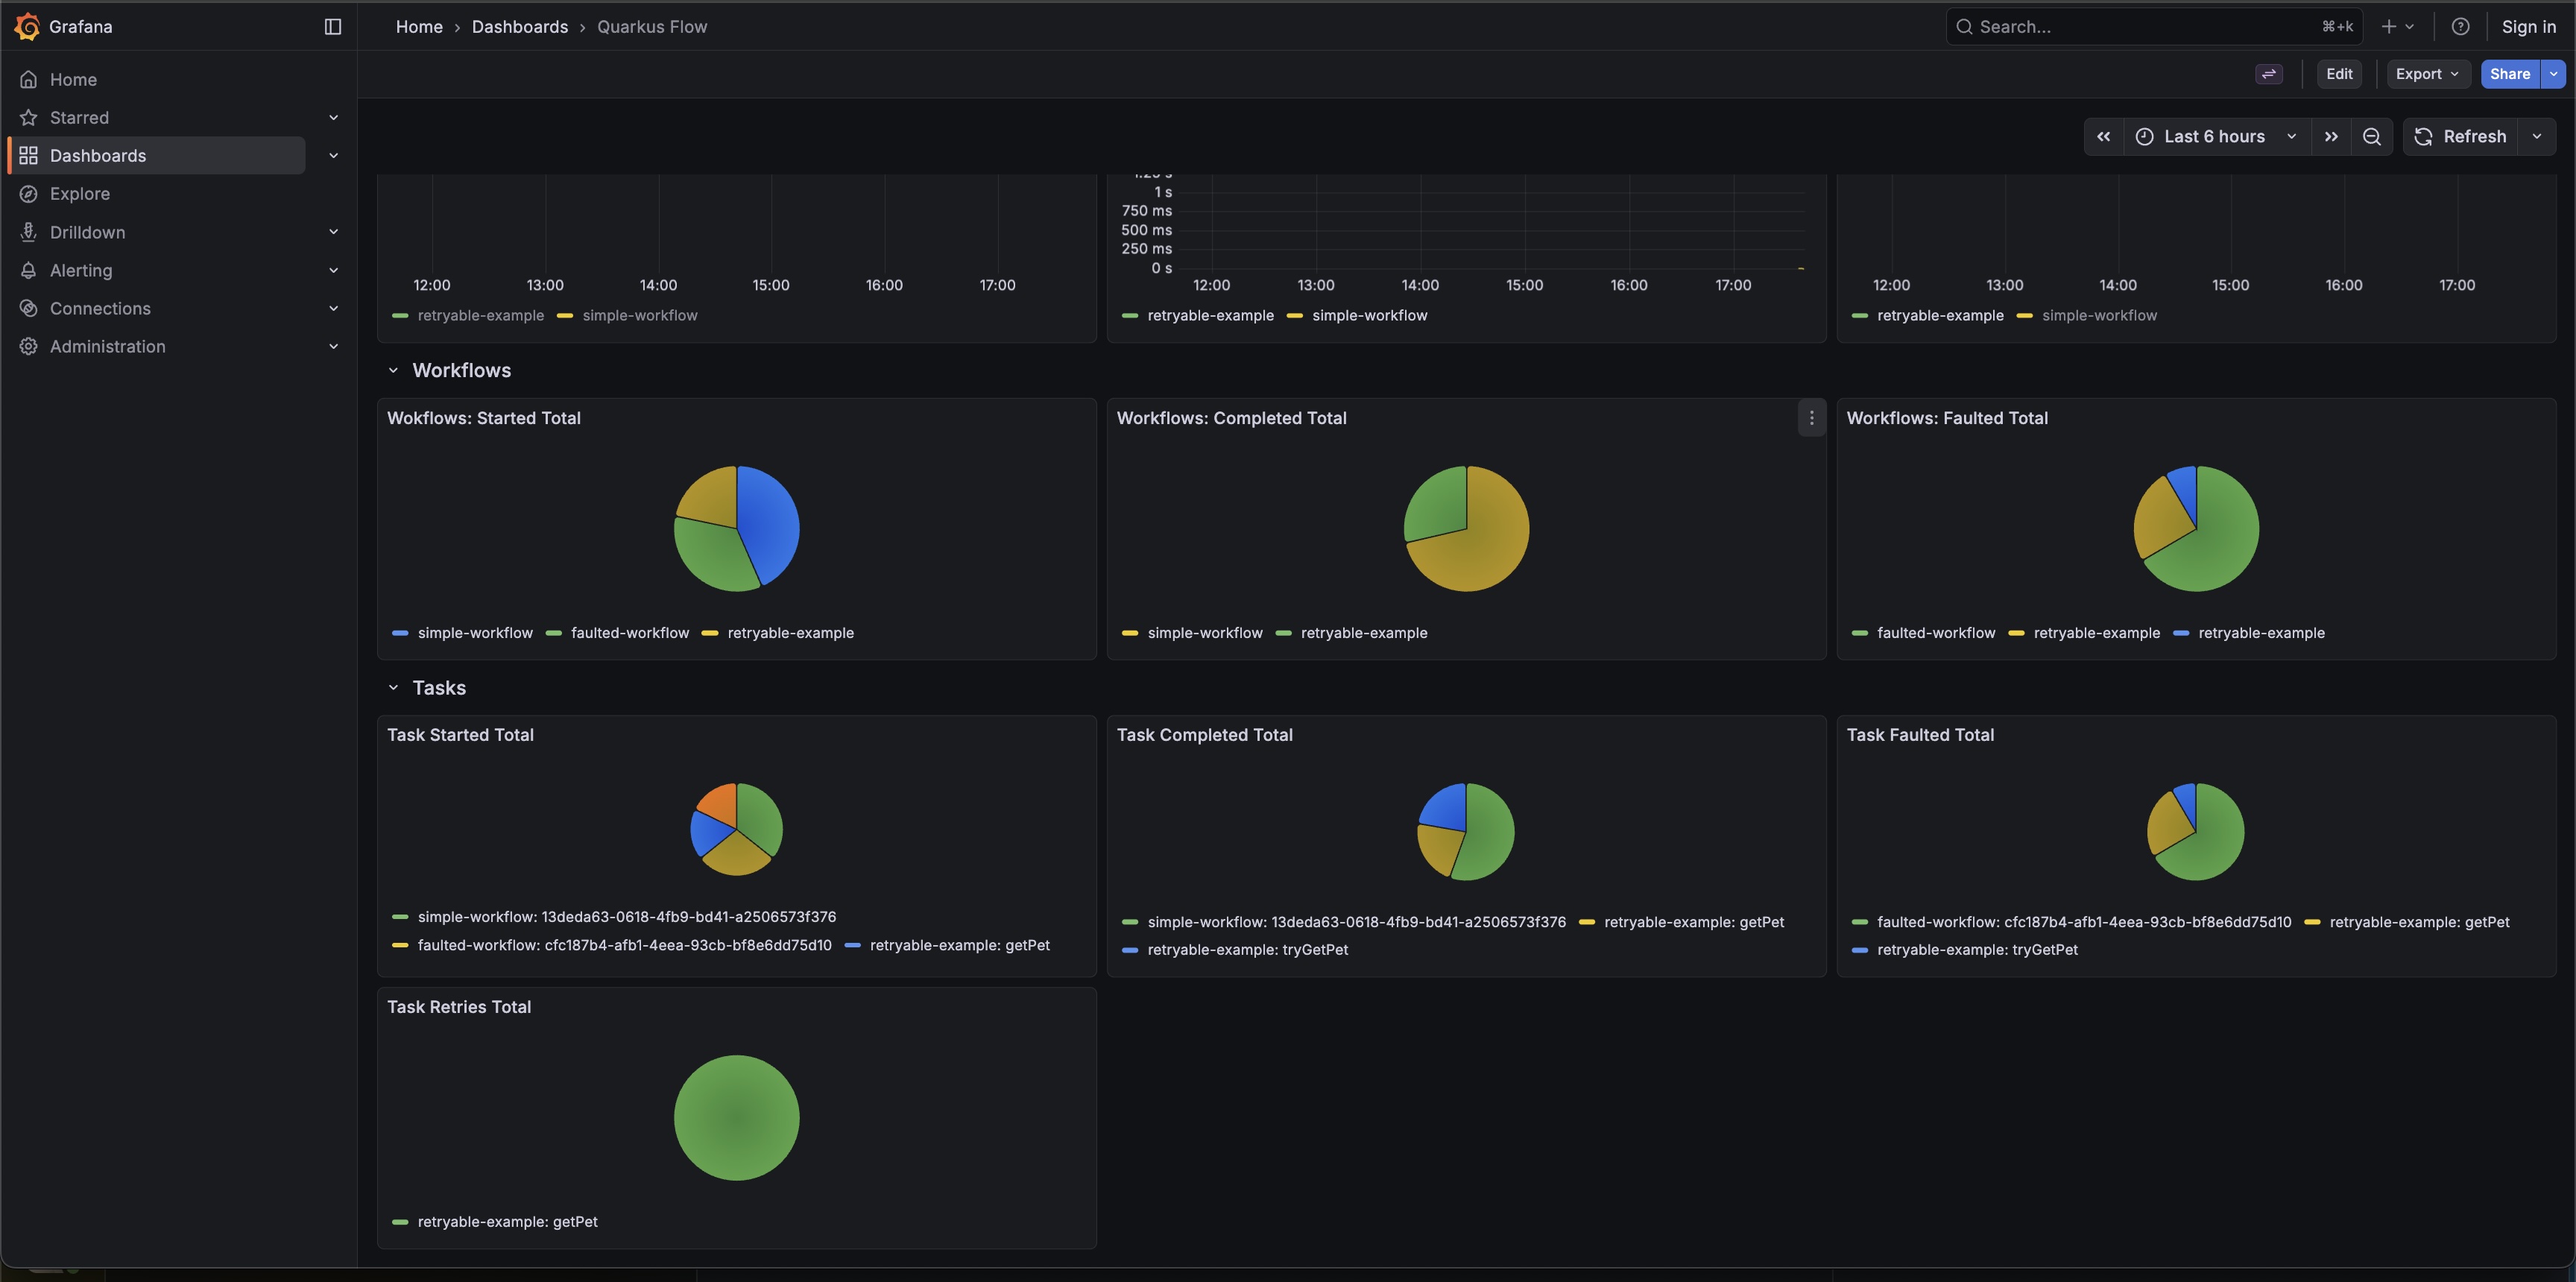
When using Quarkus Flow, a Grafana dashboard named Quarkus Flow is created automatically, providing a ready-to-use visualization of workflow metrics.
See also
-
Enable distributed tracing — complement your metrics with OpenTelemetry span tracing.
-
Export workflow data via structured logs — export detailed workflow execution data for querying and analytics.
-
Fault tolerance and resilience — configure the retry and circuit breaker logic that drives these metrics.