Enable Linux Event Tracing
To track what commands or data send to buses or from buses you need to enable linux tracing debugfs
Enable I2C tracing
sudo su
echo 'i2c:*' > /sys/kernel/debug/tracing/set_event
echo 'smbus:*' > /sys/kernel/debug/tracing/set_event|
All events will be available in |
Enable SPI tracing
sudo su
echo 'spi:*' > /sys/kernel/debug/tracing/set_event|
All events will be available in |
Enable GPIO/OneWire tracing
sudo su
echo 'gpio:*' > /sys/kernel/debug/tracing/set_event|
All events will be available in |
These commands will enable logging only for current linux session and will be disabled after reboot.
If you want to add tracing logging permanently please add commands to cmdline boot options.
For example in RaspberryPi need to update /boot/cmdline.txt and add tracing in the format below:
trace_evace_event=i2c:*,smbus:*,spi:*,gpio:*Java Embedded Framework Dev Services
When you compile your application with quarkus:dev Quarkus will enable Dev Services for JEF Extension
|
For the remote debugging from your development machine you need to run Quarkus via In this case |
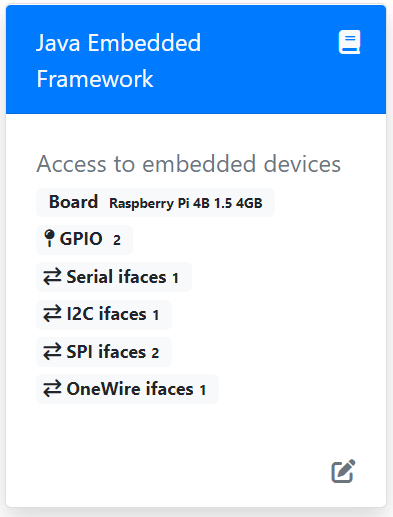
JEF DevServices widget will look like:

Some additional information about interfaces will be available if you click to the links.